


How to create presentations with AI

Infographic maker
Visualize data with engaging infographic templates, icons, timelines, flowcharts, and SmartArt in Microsoft PowerPoint.
Create engaging infographics with easy design tools
Combine design elements
Enhance any infographic with free stock images, icons, and easy-to-read fonts. Drag and drop to customize templates by adding numbers and graphics, or generate an AI image to illustrate ideas.
Polish with brand style
Create a consistent look across all infographics with custom brand color palette, logo, font, and slide backgrounds. Share branded infographics on social media, embed into presentations, and establish thought leadership.
Collaborate and edit in real-time
Team up to create infographics for school assignments, sales education, business presentations, and project timelines. Invite teammates to review and edit through presentation comments and mentions.

Present big ideas with infographic templates
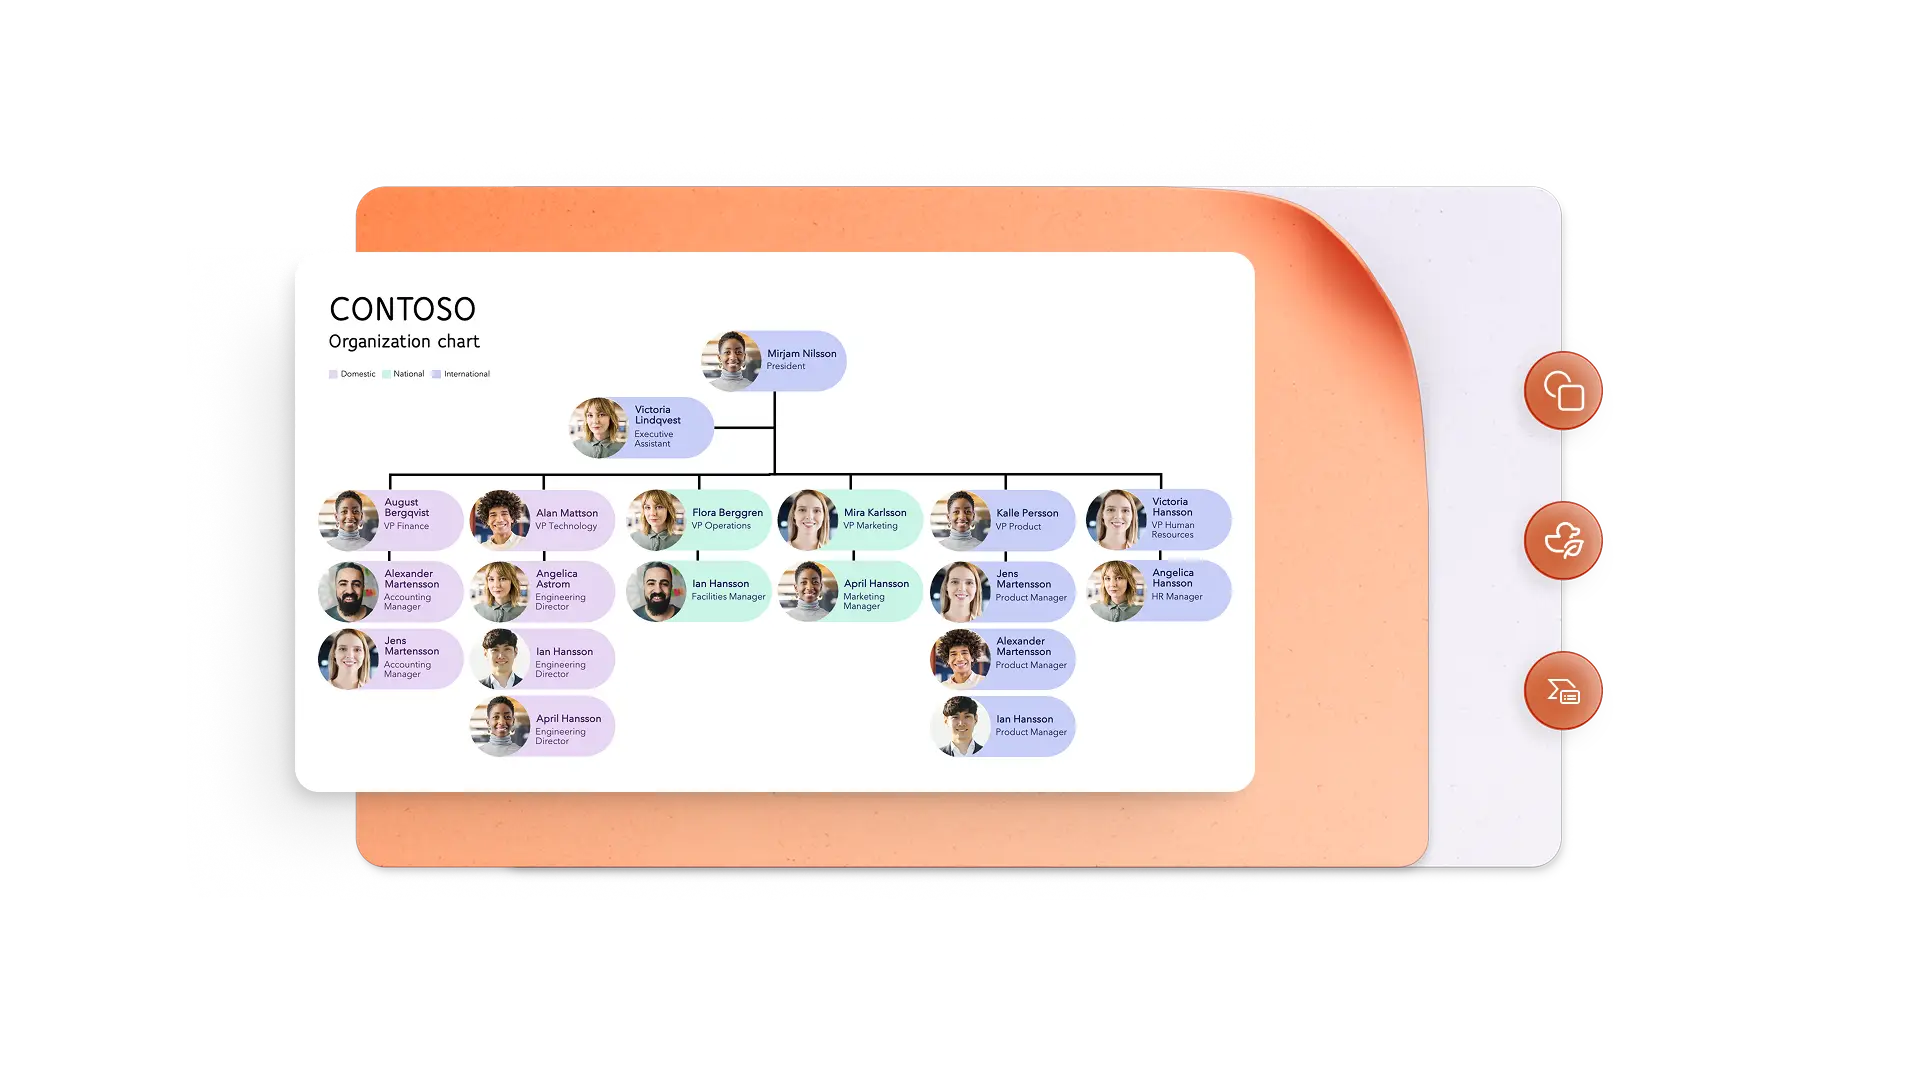
Save time with customizable infographic templates for project timelines, flowcharts, roadmaps, organization charts, and academic posters.
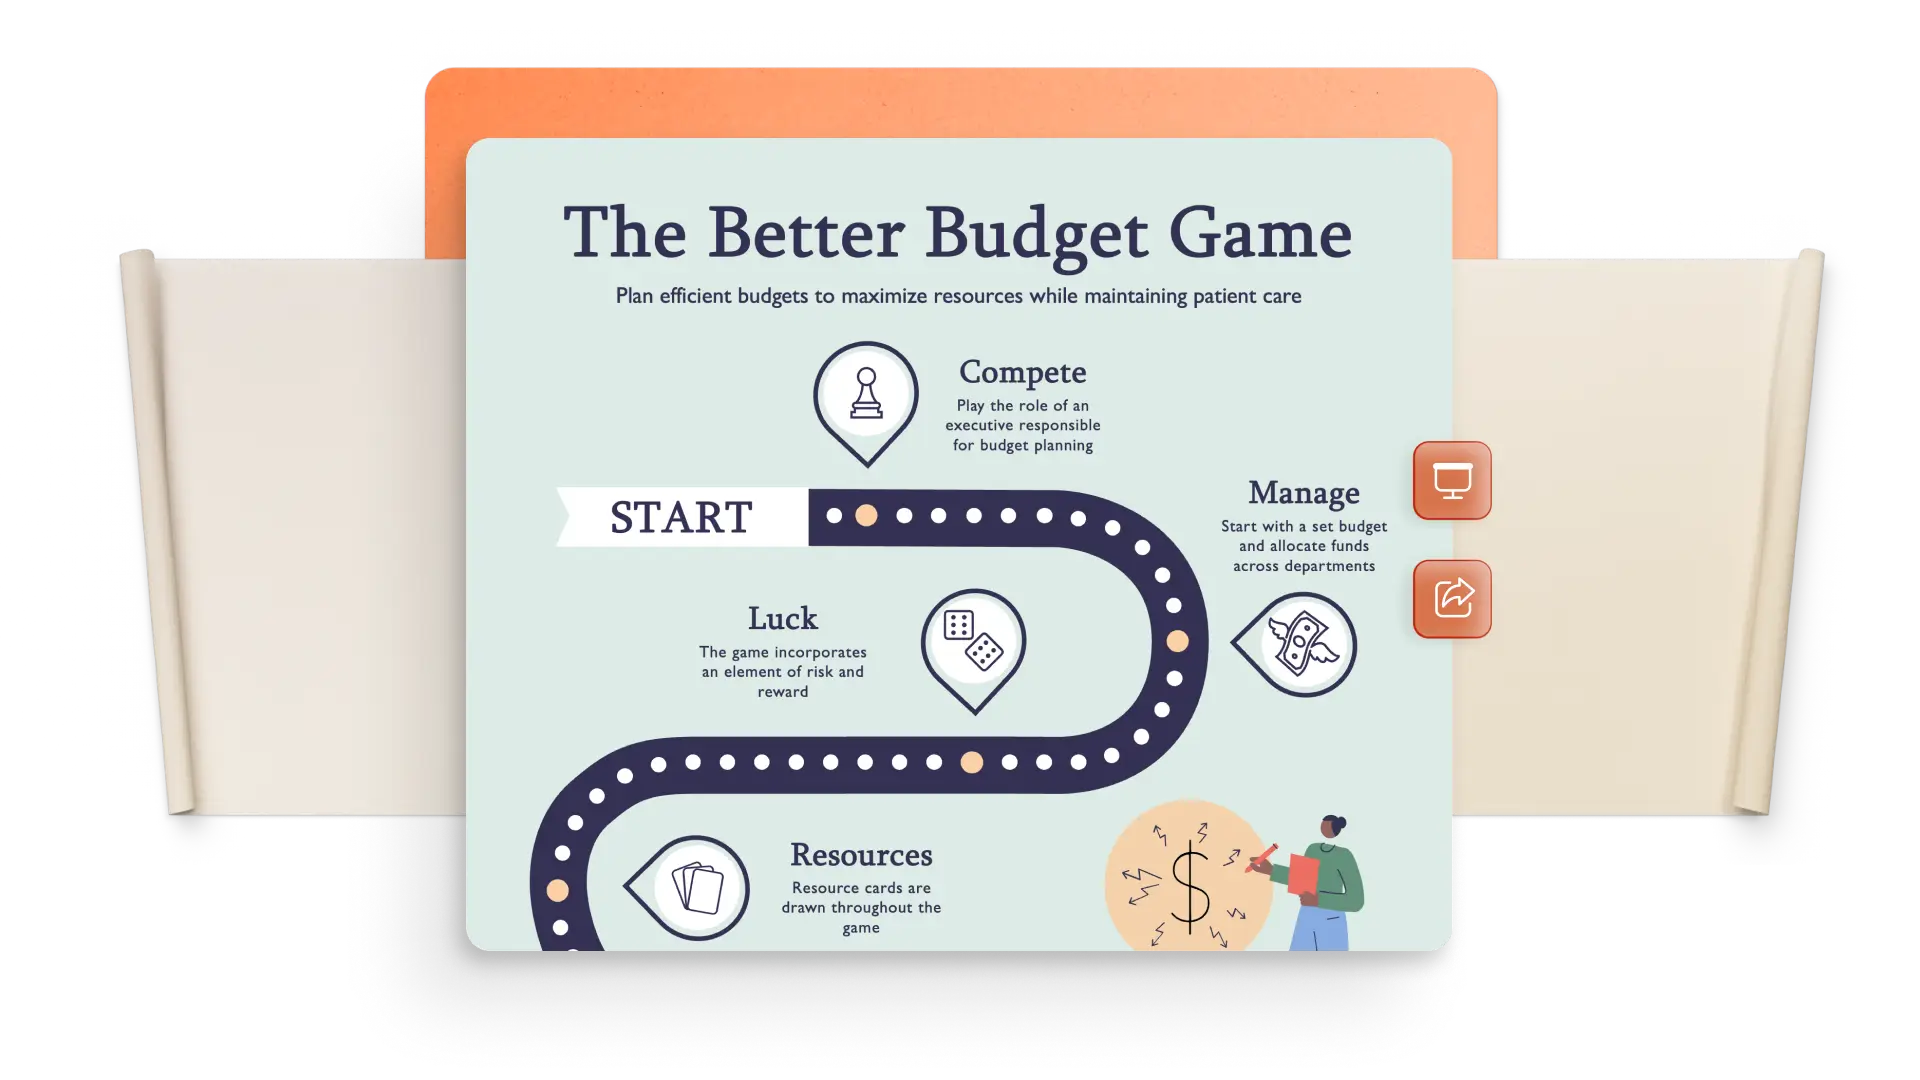
Save time with infographic templates
Get inspired with infographic templates for easy visual creation using the presentation maker. Choose sleek designs for clarity or colorful visuals for engagement. Start with eye-catching infographics that save you from the manual work of creating your own design.

Customize with visuals and icons
Simplify complex information with icons, illustrations, arrows, shapes, and lines from the PowerPoint library. Access high-quality stock images as a Microsoft 365 user to create infographics for education, work, or any purpose.
Bring information to life with charts
Make complex information easy to understand with custom SmartArt diagrams. Organize content into lists, cycles, hierarchies, and timelines. Import existing Excel tables into infographics to keep data updated.

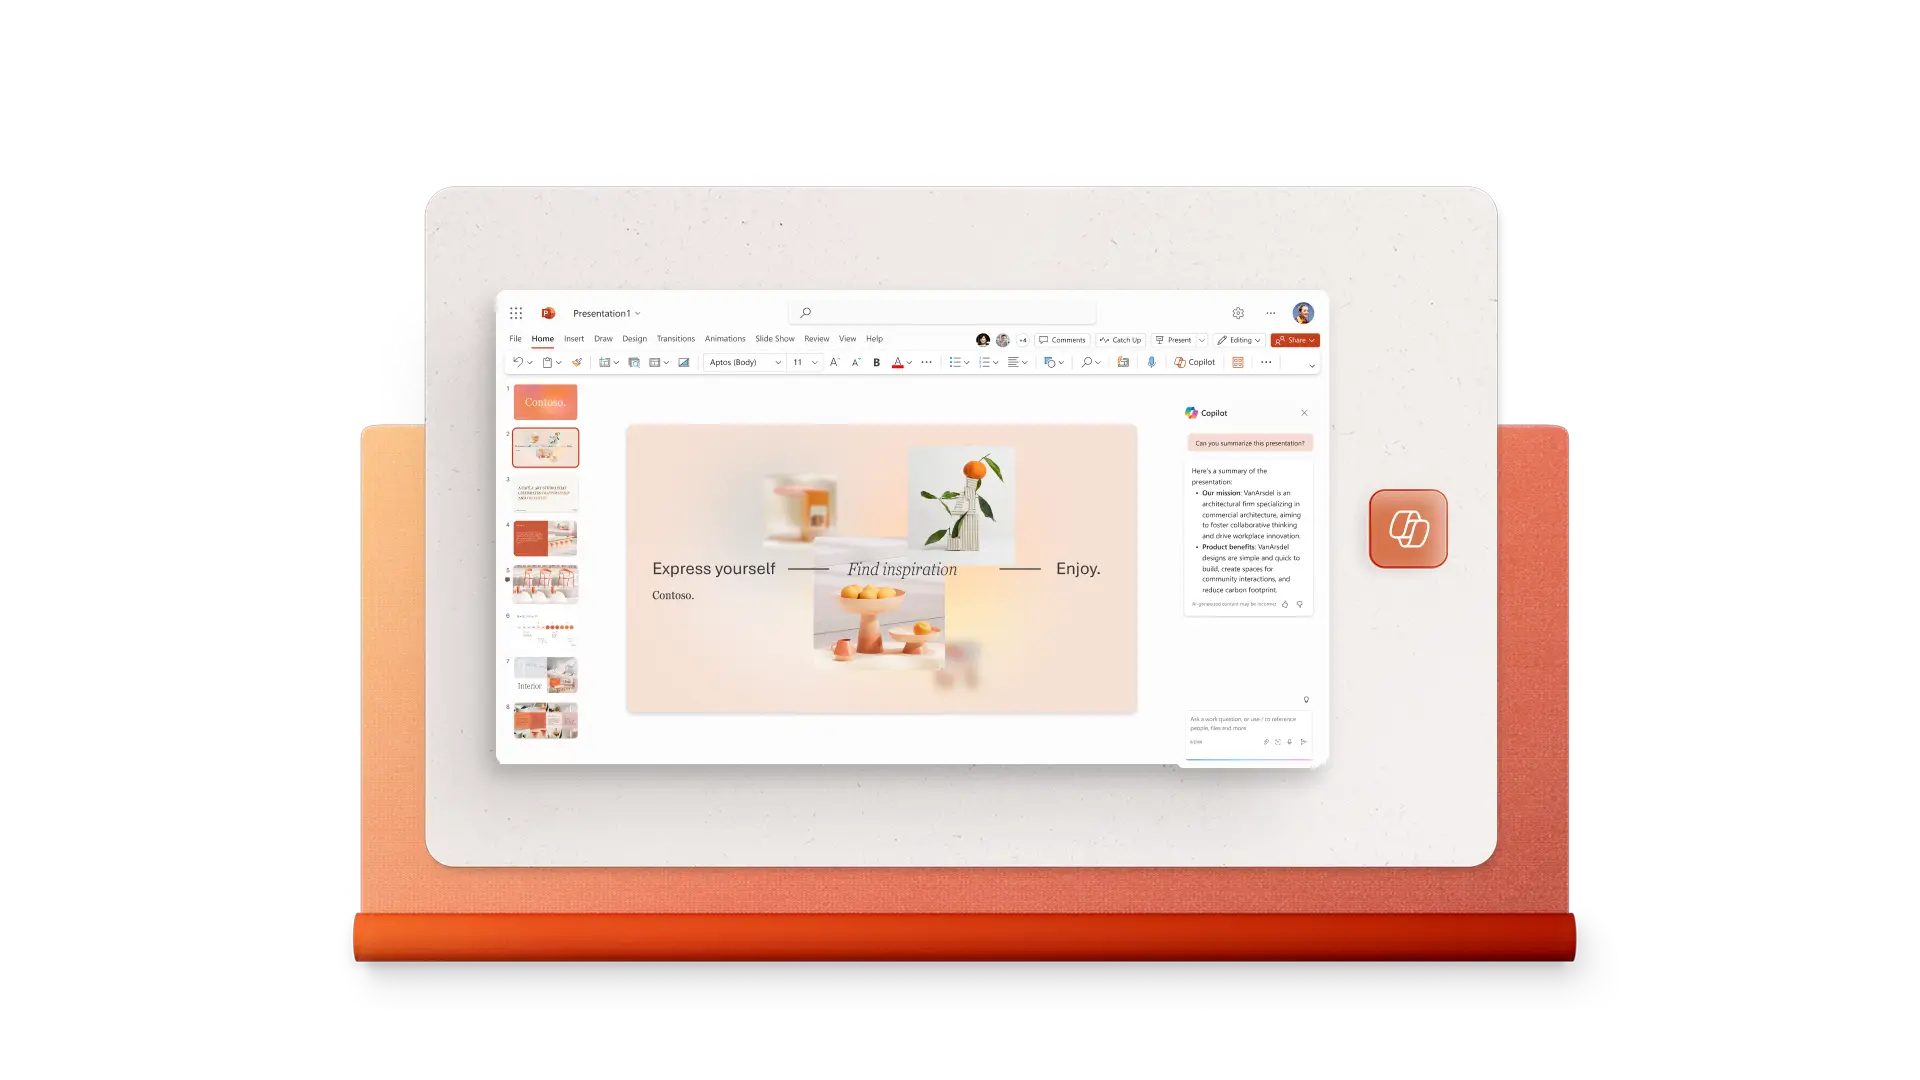
Create infographics with AI
Generate an infographic from scratch with Copilot in PowerPoint. Share topic or data to get suggestions on section titles, layouts, summaries for emails or social media, and AI images to match the content.
Collaborate to create infographics online
Invite team members to view or edit infographics using the share button in PowerPoint. Add comments and mentions to request information or reviews, and collaborate in real-time or asynchronously.

Download and share infographics instantly
Share infographics online in a slideshow with presentation mode, export as a PDF or JPG to email, upload to a website, or post on social media. Print easily using infographic presets that are always in a vertical slide format.
How to make an infographic in PowerPoint
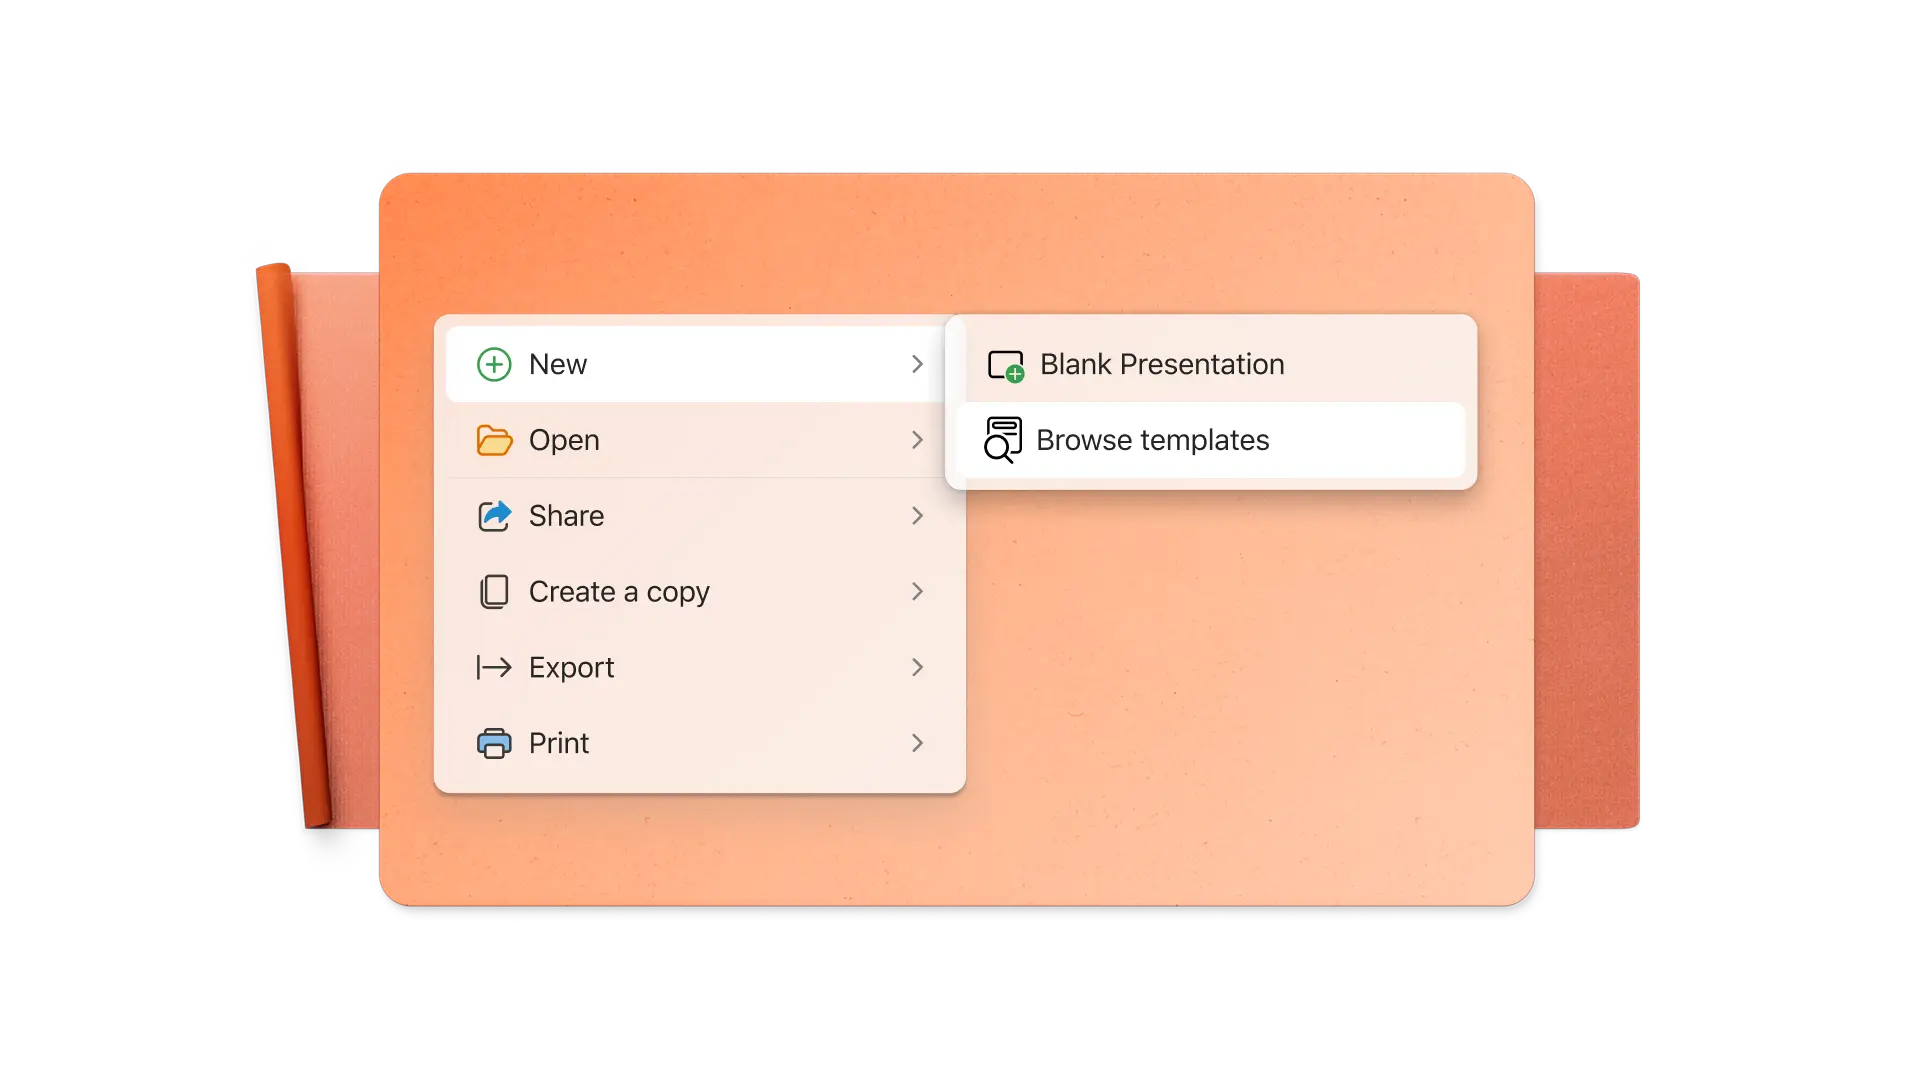
Choose an infographic template as a starting point.
Use Copilot in PowerPoint suggestions to create a background image.
Add information inside shapes and graphs.
Emphasize key points with contrasting colors and readable text.
Export and share the infographic as a PDF, JPG, or PowerPoint slideshow.
Free infographic maker for all
Marketers: create digestible social, blog, keynote, and marketing presentation content.
Organizations: sharing key points from surveys or studies, and explain product benefits.
Journalists: distill trends and stories into data-rich visuals for news reports.
School: simplify topics into helpful learning aids and poster presentations.

View our related blogs


Frequently asked questions
What is an infographic?
An infographic is a visual representation of key pieces of information and their relationships. Infographics combine text and data with shapes, colors, charts, and icons to help readers understand and retain information. They're useful in education, marketing, and business presentations, among others.
How do you get an infographic template in PowerPoint?
Search the infographic templates in PowerPoint, then select and modify the design and content to suit specific requirements.
How do you make an animated infographic in PowerPoint?
Click on animations in the ribbon menu to animate any element of an infographic in PowerPoint. Anyone viewing the infographic in presentation mode will see the selected animations as they click through it. The infographic animations can also be recorded as a video to share with a broader audience.
How to create a timeline infographic in PowerPoint?
Start with a timeline infographic from the PowerPoint template library. Next, edit the colors, images, and icons to match the timeline. A timeline can also be created from scratch. Insert a horizontal line on a landscape slide or a vertical line on a portrait slide, then add icons, images, and text.