
Financial presentations
Make clear finance decks using editable templates, visual charts, and Copilot in Microsoft PowerPoint.
Make informative finance decks easily
Customize templates and slide layouts
Start with a blank slide or adapt a finance presentation template to showcase budgets, reports, or forecasts. Replace placeholder text and adjust slide designs so content flows clearly.
Present data with charts and visuals
Insert charts and graphs to display finance data, revenue projections, and market trends. Use infographics, SmartArt, and tables to break down complex information into clear visuals.
Generate finance slides with AI
Upload finance reports, documents, or spreadsheets into the Copilot in PowerPoint chat to receive presentation outline suggestions. Review the draft and apply changes to slides as needed.

Create finance decks with ready-made templates
Choose from a range of finance presentation templates for budget reviews, quarterly reports, investment decks, and financial plans. Adapt layouts for board meetings, client reviews, or personal finance tracking.


Build finance decks with placeholder slides
Choose a presentation template featuring placeholder slides for profit and loss statements, revenue breakdowns, and financial forecasts. Replace sample content with actual data, add branding, and adjust visuals to prepare a clear presentation.

Draft outlines with Copilot
Chat with Copilot in PowerPoint to create a finance presentation by describing the topic and generating an outline to review. Once the slide deck is ready, use the PowerPoint summarizer to create a summary slide content for executive or client reviews before sharing the full deck.

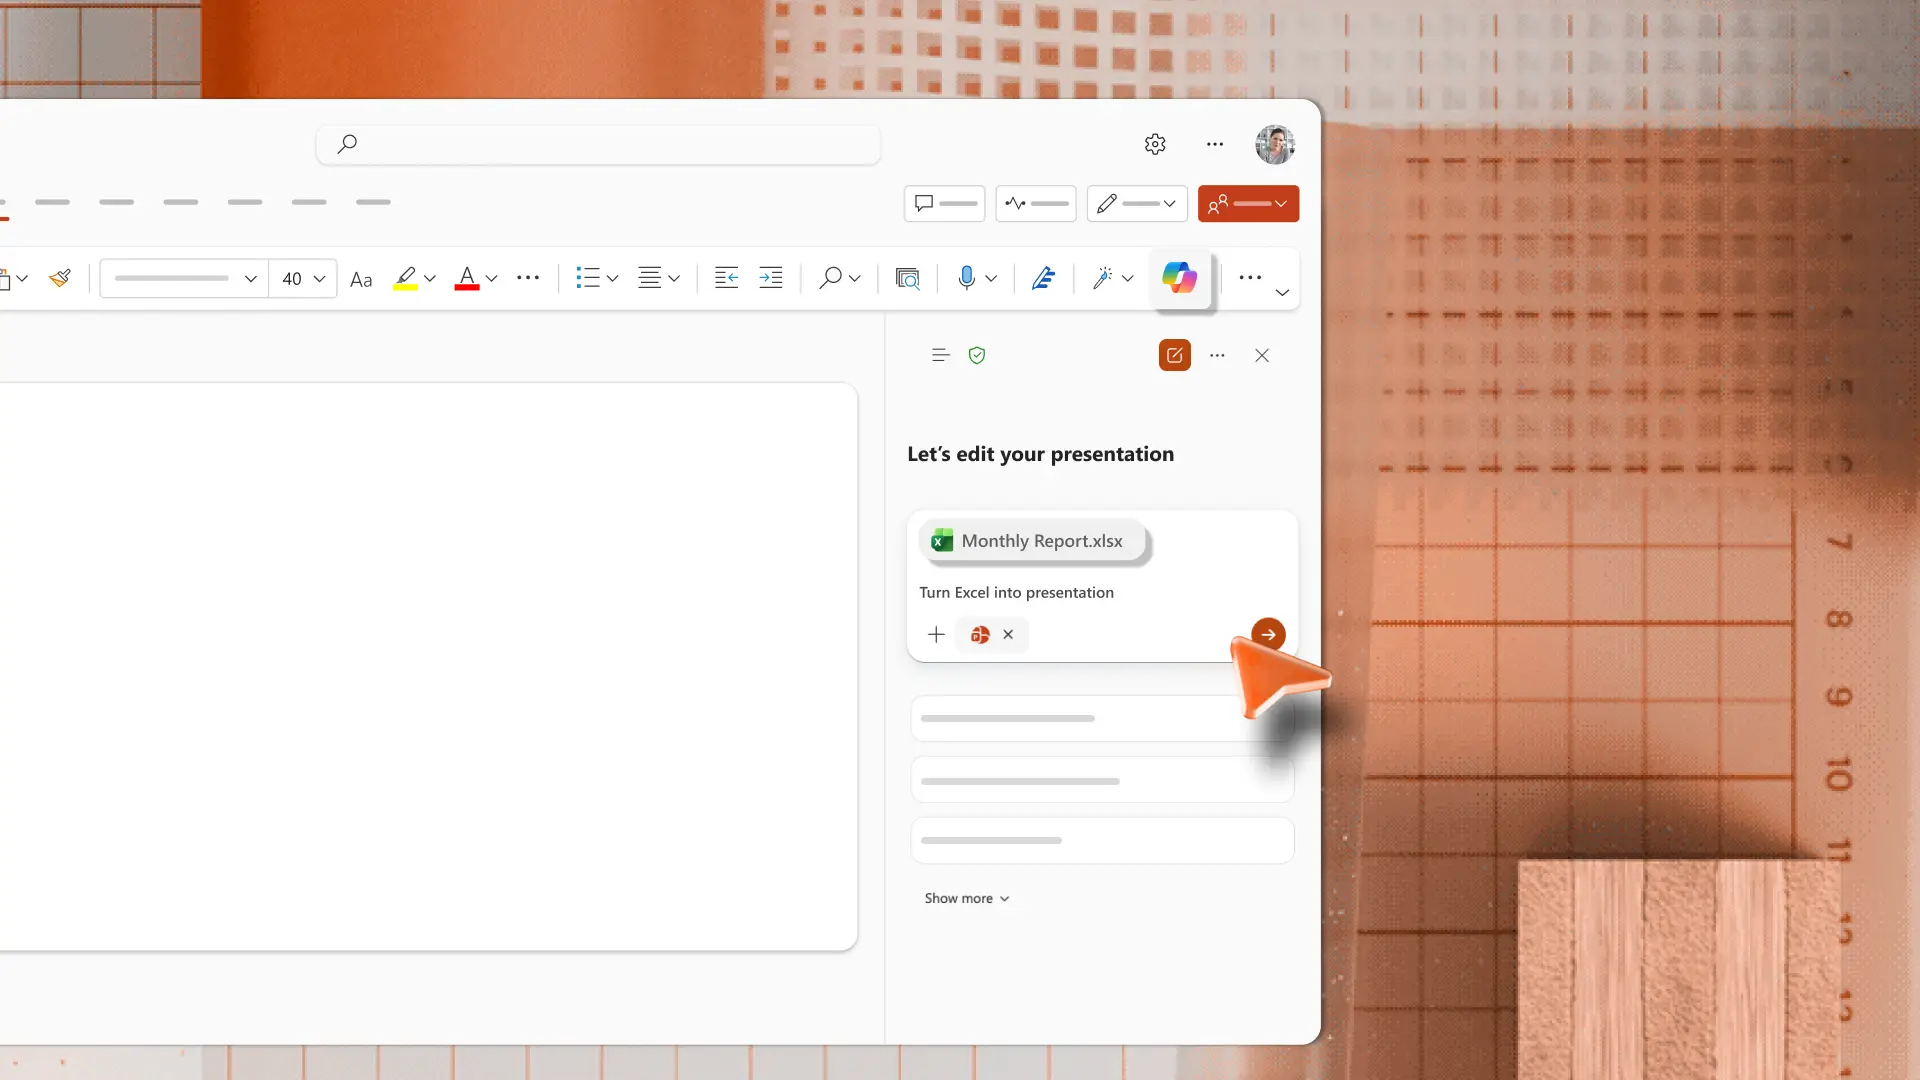
Convert Excel files into presentations with Copilot
Generate slides from existing files using the AI presentation maker in PowerPoint. Upload an Excel file or document to Copilot chat and receive a presentation outline to review and apply. Review the suggested structure to organize and format slides, so the final deck is clear and easy to follow.
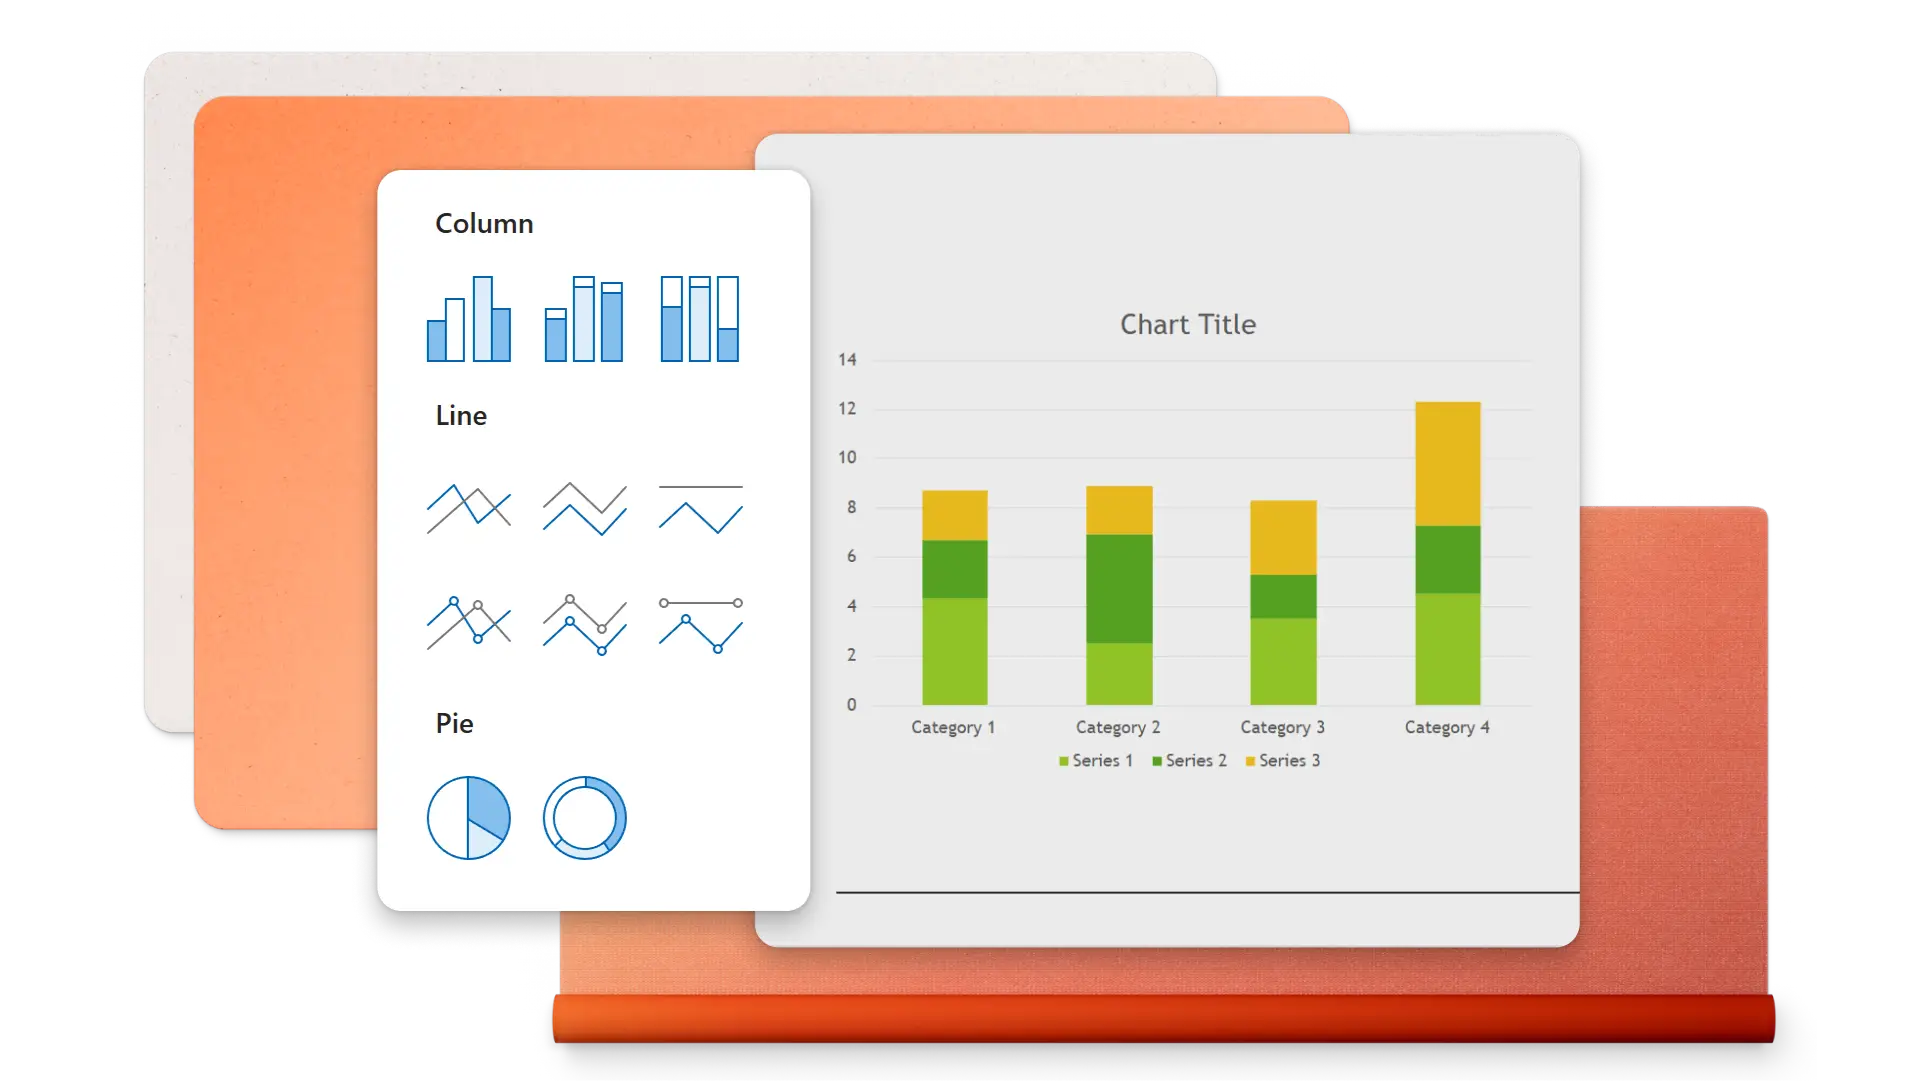
Add financial charts and diagrams
Insert charts, tables, diagrams, or timeline slides that directly support topics in a finance presentation. Use the right chart type for the data, such as line charts for trends, pie charts for proportions, or bar charts for comparisons. Keep one main insight per slide so the data supports the message.
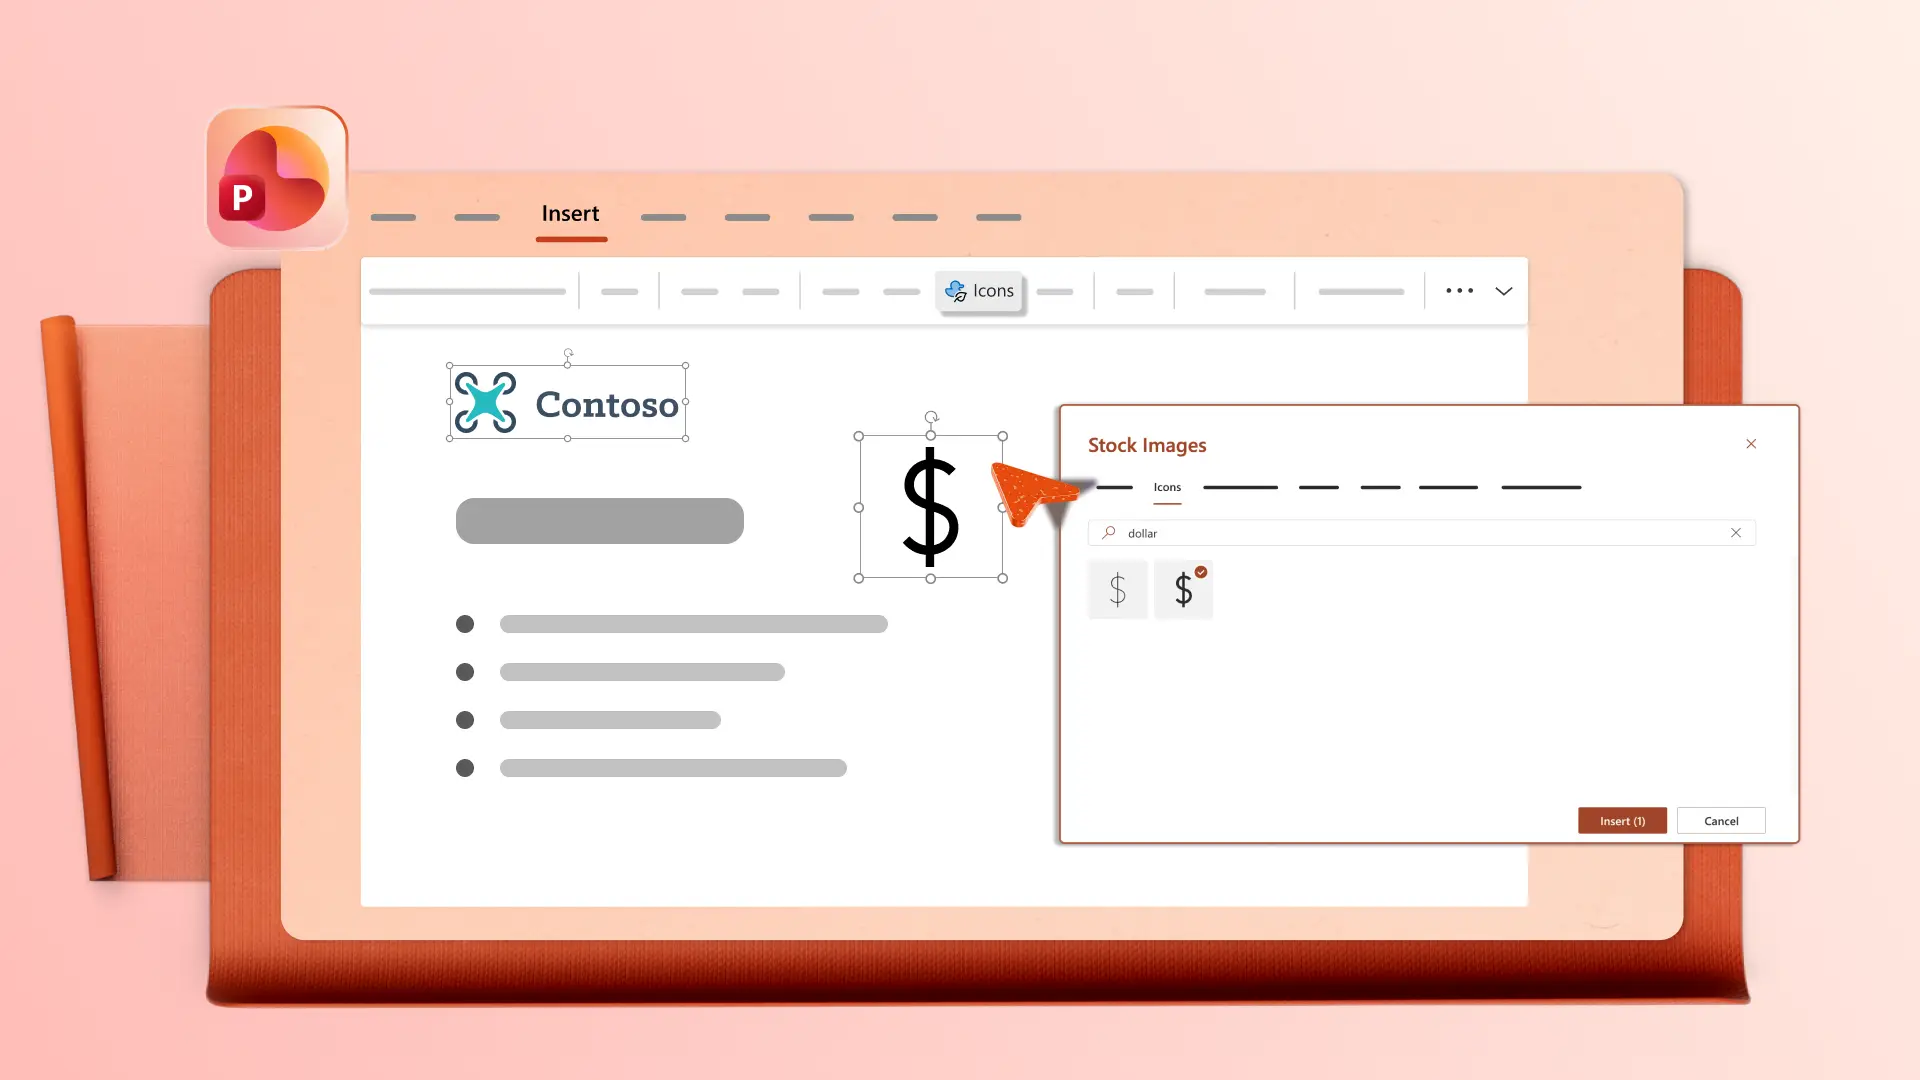
Apply brand styles to finance decks
Add a company logo, apply brand colors, and choose fonts that match brand guidelines, so finance presentations look consistent with other company materials. Open the Design tab to review layout suggestions that organize content clearly. Use clean layouts so audiences can read the data and remember key points.
Collaborate, save, and share finance decks
Edit finance presentations with a team using real-time collaboration tools like mentions and comments to review and add ideas. Download a presentation as a PDF or send a secure OneDrive link that always shows the latest version for stakeholders, clients, or board members.

How to create financial presentations in Microsoft PowerPoint
Open PowerPoint for the web and start from blank or browse finance presentation templates.
Select a template and replace placeholder content with financial data and reports.
Insert charts, tables, and visuals to support key points in each slide.
Chat with Copilot in PowerPoint to generate outlines, summaries, or slides from attached files.
Save and share presentation via OneDrive link or download as a PDF.


Frequently asked questions
What are finance presentation templates good for?
Finance presentation templates work well for budget reviews, quarterly reports, investment pitches, and financial forecasts. Share these decks with executives, investors, or clients for business purposes. Personal finance presentations can also be shared with family or colleagues. Combine finance templates with sales presentations or business presentations for broader coverage.
How should a financial presentation be structured?
Start with an executive summary that covers the main points, then move into detailed sections for revenue, expenses, profit and loss, and forecasts. Use a finance template to follow a ready-made structure and save time on formatting. End with key takeaways and next steps.
What are creative ways to present financial data?
Use charts that match the data type, such as line charts for trends, pie charts for proportions, and bar charts for comparisons. Add timeline slides to show progress over time. Keep one main insight per slide so the visuals support the story rather than replace it.
How to deliver a finance presentation well?
Follow a clear structure using a finance template to cover key areas like summaries, data, and forecasts. Practice delivery with the coach in PowerPoint to review pacing, tone, and filler words. Keep slides focused on one insight each so the audience can follow along.