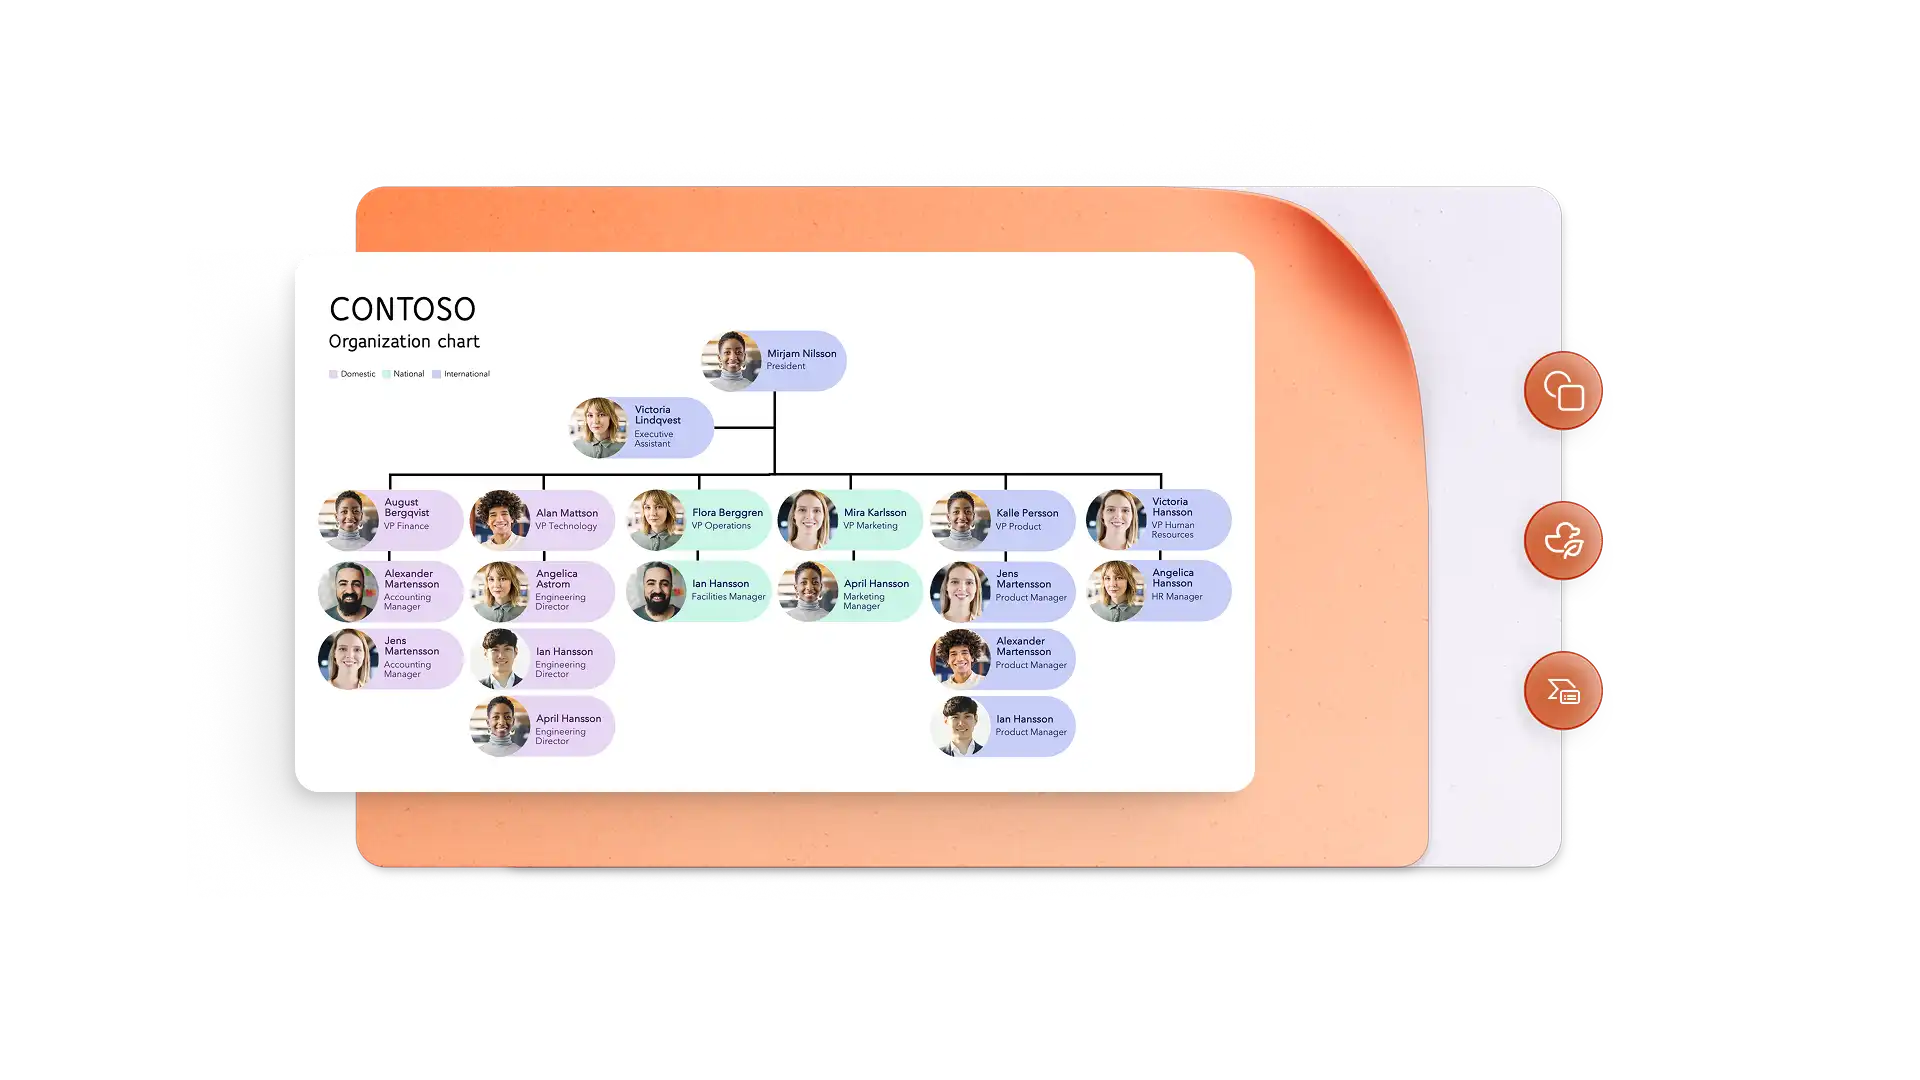
A flowchart shows the steps of a process in order, making it easy to understand a workflow from start to finish. Adding a flowchart to a slide in Microsoft PowerPoint is a good way to present a process, workflow, or decision clearly in a presentation.
This guide covers how to create a flowchart in PowerPoint with SmartArt, use shapes and connectors for customized flowcharts, or organize text into an infographic with Copilot in PowerPoint.
What is a flowchart?
A flowchart is a diagram that shows the steps of a process in order. Each step sits inside a shape, and arrows connect the shapes to show which step comes next. It splits into a separate path when a process reaches a choice, such as approving or rejecting a request.
In the workplace, flowcharts are commonly used for onboarding new employees, sharing steps for approvals, mapping sales journeys, or simply showing how a task moves from one team to another. A PowerPoint flowchart puts this information on a slide, so a team can review the process together during a meeting or training session.
Choose the right way to create a flowchart in PowerPoint
Select the method based on the number of decisions the process and the amount editing needed over the layout. A short process with steps in one direction fits a ready-made layout, while a process with multiple decisions needs more control over each step. Here’s how PowerPoint can provide a starting layout.
SmartArt: this option works best for simple processes with steps in one direction. It is quick to set up, but it is harder to use when a decision leads to more than one path.
Shapes and connectors: choose this method for detailed workflows with decisions and more than one path. It takes more setup than SmartArt, but it allows editing over symbols, paths, and layout.
Copilot in PowerPoint: this option is suitable when there are written steps or a work document available to attach to give AI context to turn it into a slide graphic. Review the draft to check the steps and order are correct, and then refine it in PowerPoint.
How to create a flowchart with SmartArt
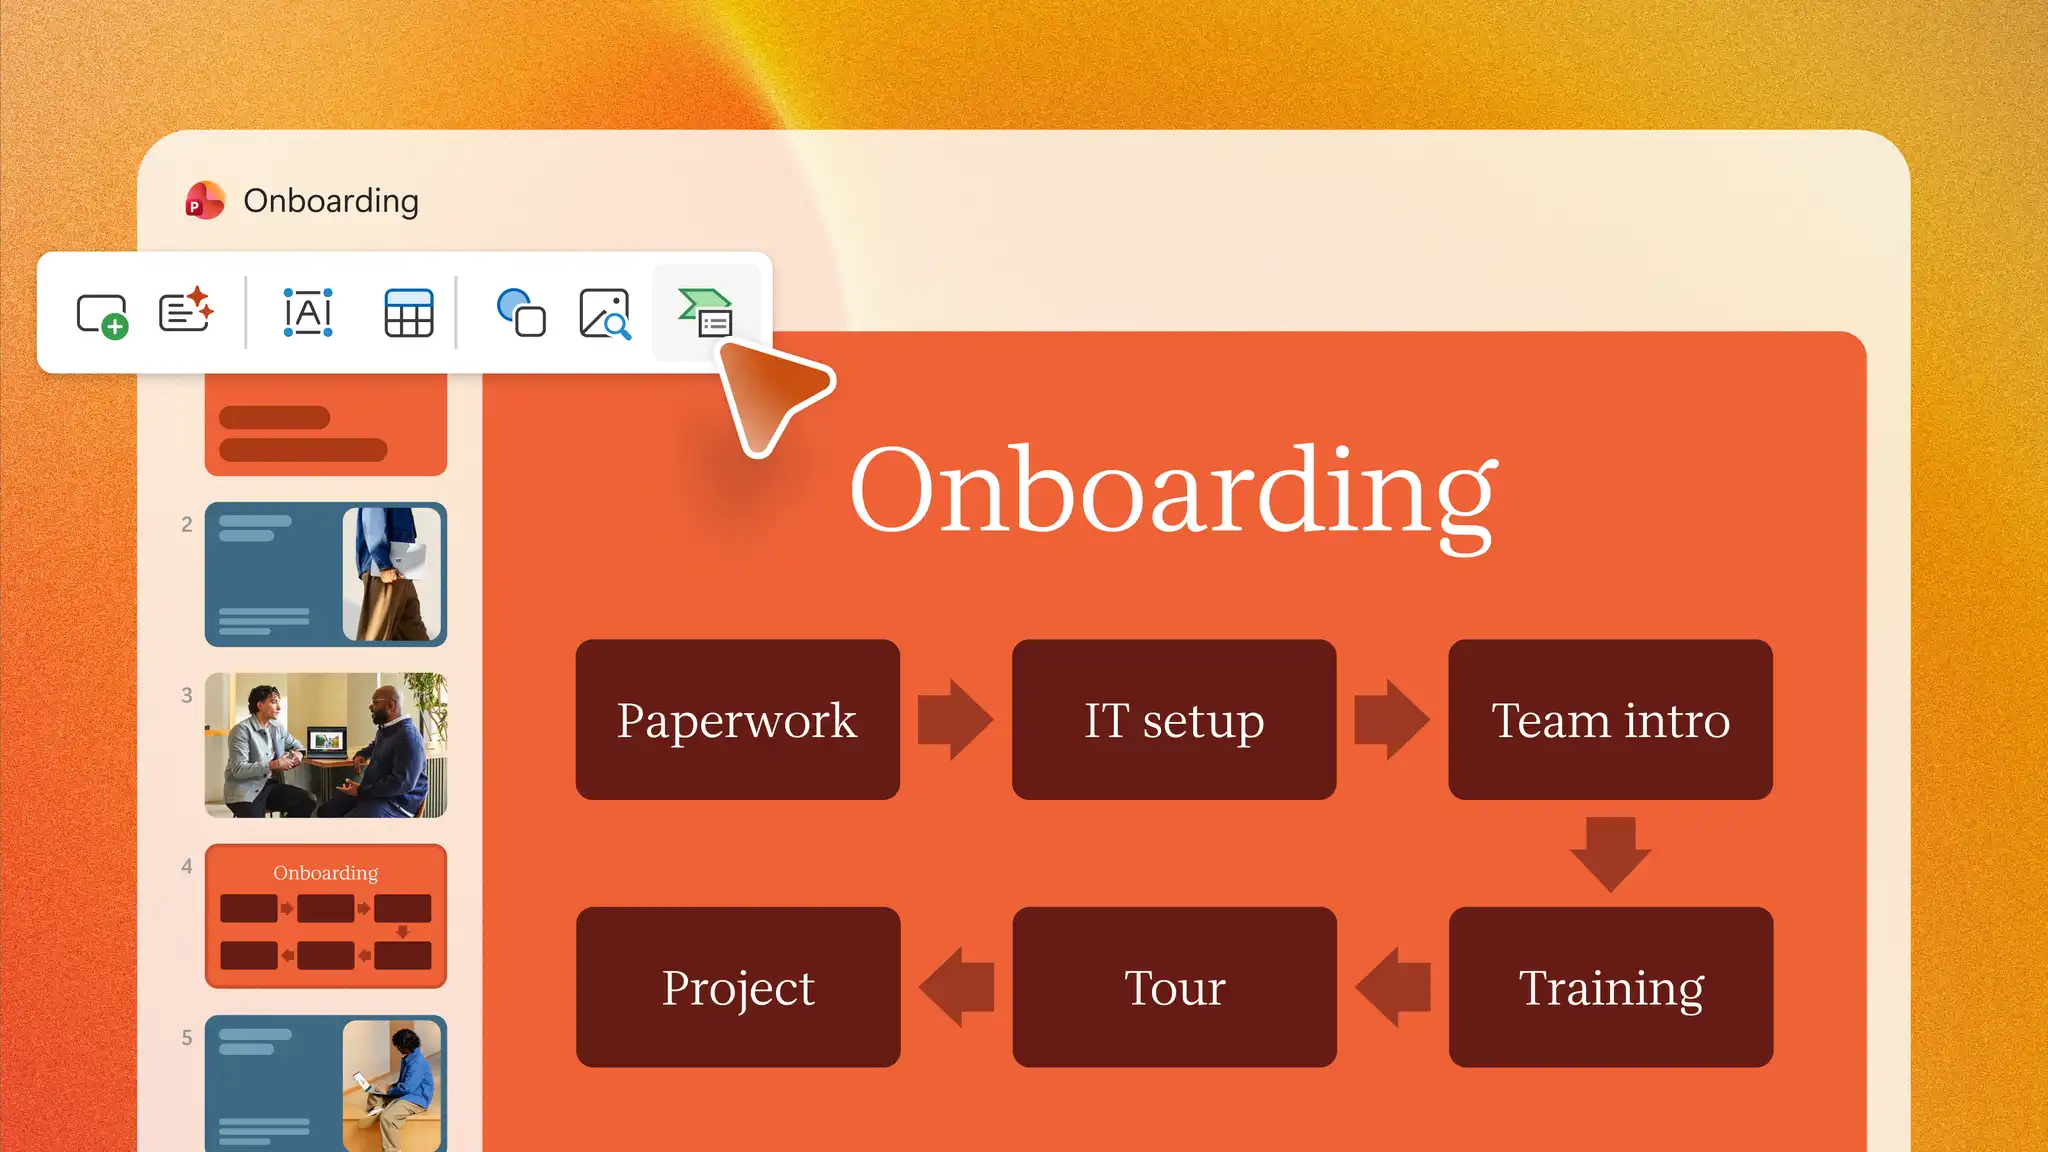
SmartArt works for a simple process where each step follows the one before it, with no decisions along the way. An employee onboarding process is a good example, since it moves in a clear order from welcome and paperwork to IT setup, team introductions, and first-week training. Follow the steps to get started.
Open a presentation in PowerPoint for the web and add a new slide from the Home tab, choosing a slide layout where the diagram can be added, such as Title Only.
On the Insert tab, select SmartArt to add a flow chart into the slide.
Select the Process category, choose a layout such as Basic Bending Process or Accent Process, and then select OK to add it to the slide. Alternatively, pick a layout that can support a flow chart with pictures for each step.
Replace each [Text] placeholder with a short label for one onboarding step, such as “complete paperwork” or “meet the team”.
With the graphic selected, go to the SmartArt Design tab and select Change Colors or pick a style from the SmartArt Styles gallery to complete customizing the flowchart.
For processes with decisions or more than one path, shapes and connectors give more control.
How to create a flowchart with shapes and connectors
The shapes and connectors in Microsoft PowerPoint provide more control over symbols, branches, paths, and layout, which makes this method useful for processes with decisions and standard symbols in business presentations.
Prepare by writing each step of the process in order and mark every point where a decision leads to more than one path.
Add a blank slide, then navigate to the Insert tab, select Shapes, and choose Terminator, Process, and Decision shapes from the Flowchart section.
Select each shape and type a short label, such as “Submit request” for a Process shape or “Approved?” for a Decision shape.
Navigate back to Shapes and select an arrow connector from the Lines section. Drag it from a connection point on one shape to the next, so it stays attached and moves with the shapes when the layout changes.
Insert a text box next to each path that leaves a Decision shape to add labels such as “Yes” or “No,” then select Align on the Shape Format tab to line up and space the shapes evenly.
View the slide in Slide Show mode to confirm that every label is easy to read, and check that each connector remains attached to the intended shape, and reroute any crossing lines.
Common flowchart symbols
Standard symbols give each part of a flowchart a meaning, so viewers can tell actions apart from decisions.
Rounded rectangle: this shape marks where a process begins and where it ends.
Rectangle: each rectangle holds one action or step, such as sending a request.
Diamond: a decision goes inside this shape, with a separate path for each possible answer.
Arrow or connector: these lines point from one step to the next to show the direction of the process.
Use Copilot in PowerPoint to generate a flowchart
As a starting point, Copilot in PowerPoint can help organize a written process into a slide structure. The AI assistant in PowerPoint can identify a suitable infographic style to match the information and enhance flowchart designs. Learn how to generate a flowchart with AI using this simple workflow where a customer support escalation process is used as an example below.
Open a new or existing presentation in PowerPoint online and select Copilot to start a chat.
Describe the process slide to AI using the chat, including each stage and the point where the process splits into different paths. Alternatively, attach a process document into the chat for AI to create the flowchart steps from.
Review the slide that Copilot suggests, and ensure it is accurate in steps, decisions, and readability.
Refine the text and design or rebuild the flow with shapes and connectors when the process needs standard symbols and labeled paths.
Note: Copilot availability depends on the Microsoft 365 Business, Personal, or Family plan. Available features may vary based on subscription.

Common types of flowcharts
Different types of flowcharts suit different goals. Knowing how they differ makes it easier to pick the right format for a slide.
Process flowchart: this type lists the steps of a task in order from start to finish. A business process flowchart for order fulfillment is a common example.
Decision flowchart: choices are the focus here, with each answer leading to its own path. A purchase approval with yes and no answers fits this format well.
Workflow diagram: teams use this format to see how work passes between people or departments, such as a support ticket moving from the help desk to a specialist.
Process map: for a wider view of a business process, a process map adds details such as who is responsible for each step. A process map can help teams review how work moves through a department and identify areas for further investigation.
Design tips for professional flowcharts
Clear design helps an audience follow each step of a flowchart without confusion. Use these tips to improve readability, create visual consistency, and make the flowchart easier to present.
Write short, clear labels
Short text labels are easier to scan when the slide is presented on a large screen. Start each process label with a verb, such as “Send invoice,” and phrase each decision as a question, such as “In stock?”
Follow one reading direction
Audiences expect a flowchart to move from top to bottom or from left to right. Place the start shape at the top or on the left and avoid arrows that loop back unless the process repeats a step.
Space and align shapes evenly
Uneven gaps make a flowchart look confusing. Turn on Gridlines or Guides from the View tab to place shapes at equal distances and line up connectors cleanly.
Choose colors with strong contrast
Dark text on a light shape, or light text on a dark shape, stays readable on a projector and for viewers with low vision. Color can group related steps, but the flowchart should still make sense without it, because viewers may perceive colors differently.
Apply one style to each shape type
Every process shape should share the same size, color, and font, and every decision shape should match the other decision shapes. After formatting one shape, select Format Painter on the Home tab to copy its style to the rest.
Add brand colors and fonts with care
Brand colors and fonts help a flowchart match the rest of the presentation. Set the colors through the theme colors on the Design tab, and follow the brand guidelines used for other company presentations.
Check the slide at presentation size
A flowchart that looks clear while editing may be hard to read on a large screen. Preview the slide in Slide Show mode, and edit the steps if the labels look too small.

Use PowerPoint templates and infographics to create flowcharts
Templates reduce setup and formatting work because the layout, colors, and fonts are already in place. Explore PowerPoint infographic templates for layouts that can be adapted to visual workflows, approval paths, onboarding journeys, and customer journeys. If the goal is to communicate timing rather than decision paths, a timeline slide or project planning template may be more effective.
Create flowcharts to make complex processes easier to understand, discuss, and present in PowerPoint. Once the flowchart is in place, thoughtful design can make it even more effective. Explore the AI presentation designer for layout inspiration, or browse the infographic maker for templates that help turn process information into polished visuals.
Frequently asked questions
- Should SmartArt or shapes be used for a flowchart?
SmartArt works best for short processes that move in one direction, and shapes work best for processes with decisions or multiple paths. Shapes and connectors take more setup but provide greater control over symbols, labels, branches, and layout.
- What is the easiest way to make a flowchart in PowerPoint?
SmartArt is the easiest way to make a flowchart in PowerPoint when the steps follow one simple order. Select SmartArt on the Insert tab, choose a layout from the Process category, and type a label for each step.
- What is the difference between a flowchart and a process map?
A flowchart focuses on the steps and decisions in a process. A process map usually gives a wider view, including how work moves between people or teams and who is responsible for each step.
- Can AI generate a flowchart in PowerPoint?
Organize a process into a starting slide structure based on a description in the chat with Copilot, the AI presentation maker in PowerPoint. Review the results for missing steps, incorrect order, and unclear decisions, and then refine it in PowerPoint.