
Budżet kwartalny
Użyj tego szablonu

Twórz przejrzyste zbiory slajdów dotyczące finansów, korzystając z edytowalnych szablonów, wykresów z wizualizacją i funkcji Copilot w programie Microsoft PowerPoint.

Zacznij od pustego slajdu albo dostosuj szablon prezentacji finansowej, aby pokazać budżety, raporty lub prognozy. Zamień tekst zastępczy i dostosuj projekty slajdów, aby zawartość przepływała wyraźnie.

Wstaw wykresy i grafiki, aby pokazać dane finansowe, prognozy przychodów i trendy rynkowe. Używaj infografik, grafik SmartArt i tabel, aby podzielić złożone informacje na przejrzyste wizualizacje.

Przekaż raporty finansowe, dokumenty lub arkusze kalkulacyjne do funkcji Copilot w programie PowerPoint, aby otrzymywać sugestie konspektu prezentacji. Sprawdź wersję roboczą i w razie potrzeby wprowadź zmiany na slajdach.

Wybieraj spośród wielu szablonów prezentacji finansowych do przeglądów budżetu, raportów kwartalnych, prezentacji inwestycyjnych i planów finansowych. Dostosuj układy do spotkań zarządu, przeglądów dla klientów lub śledzenia finansów osobistych.
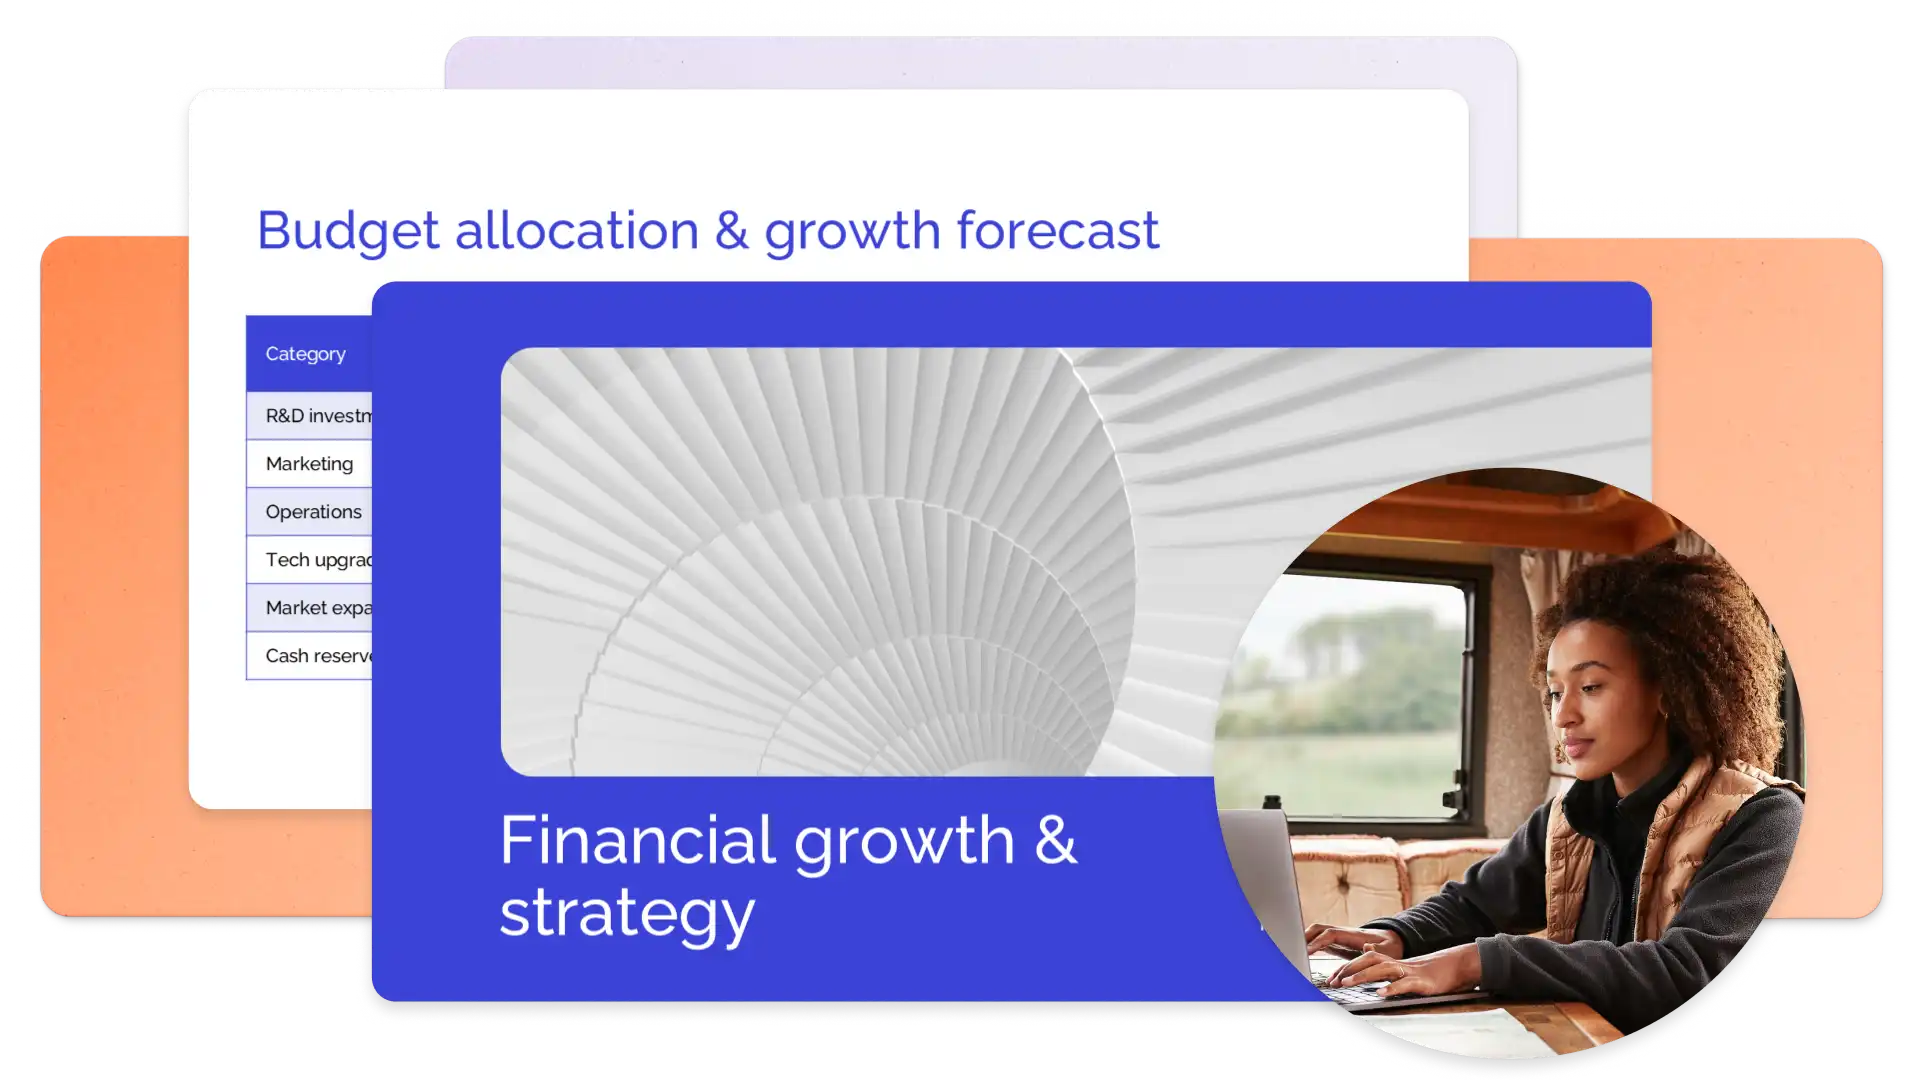
Choose a presentation template featuring placeholder slides for profit and loss statements, revenue breakdowns, and financial forecasts. Replace sample content with actual data, add branding, and adjust visuals to prepare a clear presentation.
Pracuj szybciej dzięki funkcji Copilot w programie PowerPoint. Szybko dostosuj prezentację finansową dzięki temu, że funkcja Copilot może zaktualizować projekty slajdów, dodać odpowiednie obrazy i utworzyć prezentację przy użyciu szablonu Twojej marki. Generuj sugestie treści i slajdy podsumowujące, rozmawiając z funkcją Copilot, a potem dopracuj slajdy za pomocą automatycznej modyfikacji. Kiedy wszystko będzie gotowe, udoskonal umiejętności prezentacji dzięki funkcji trener prelegenta.
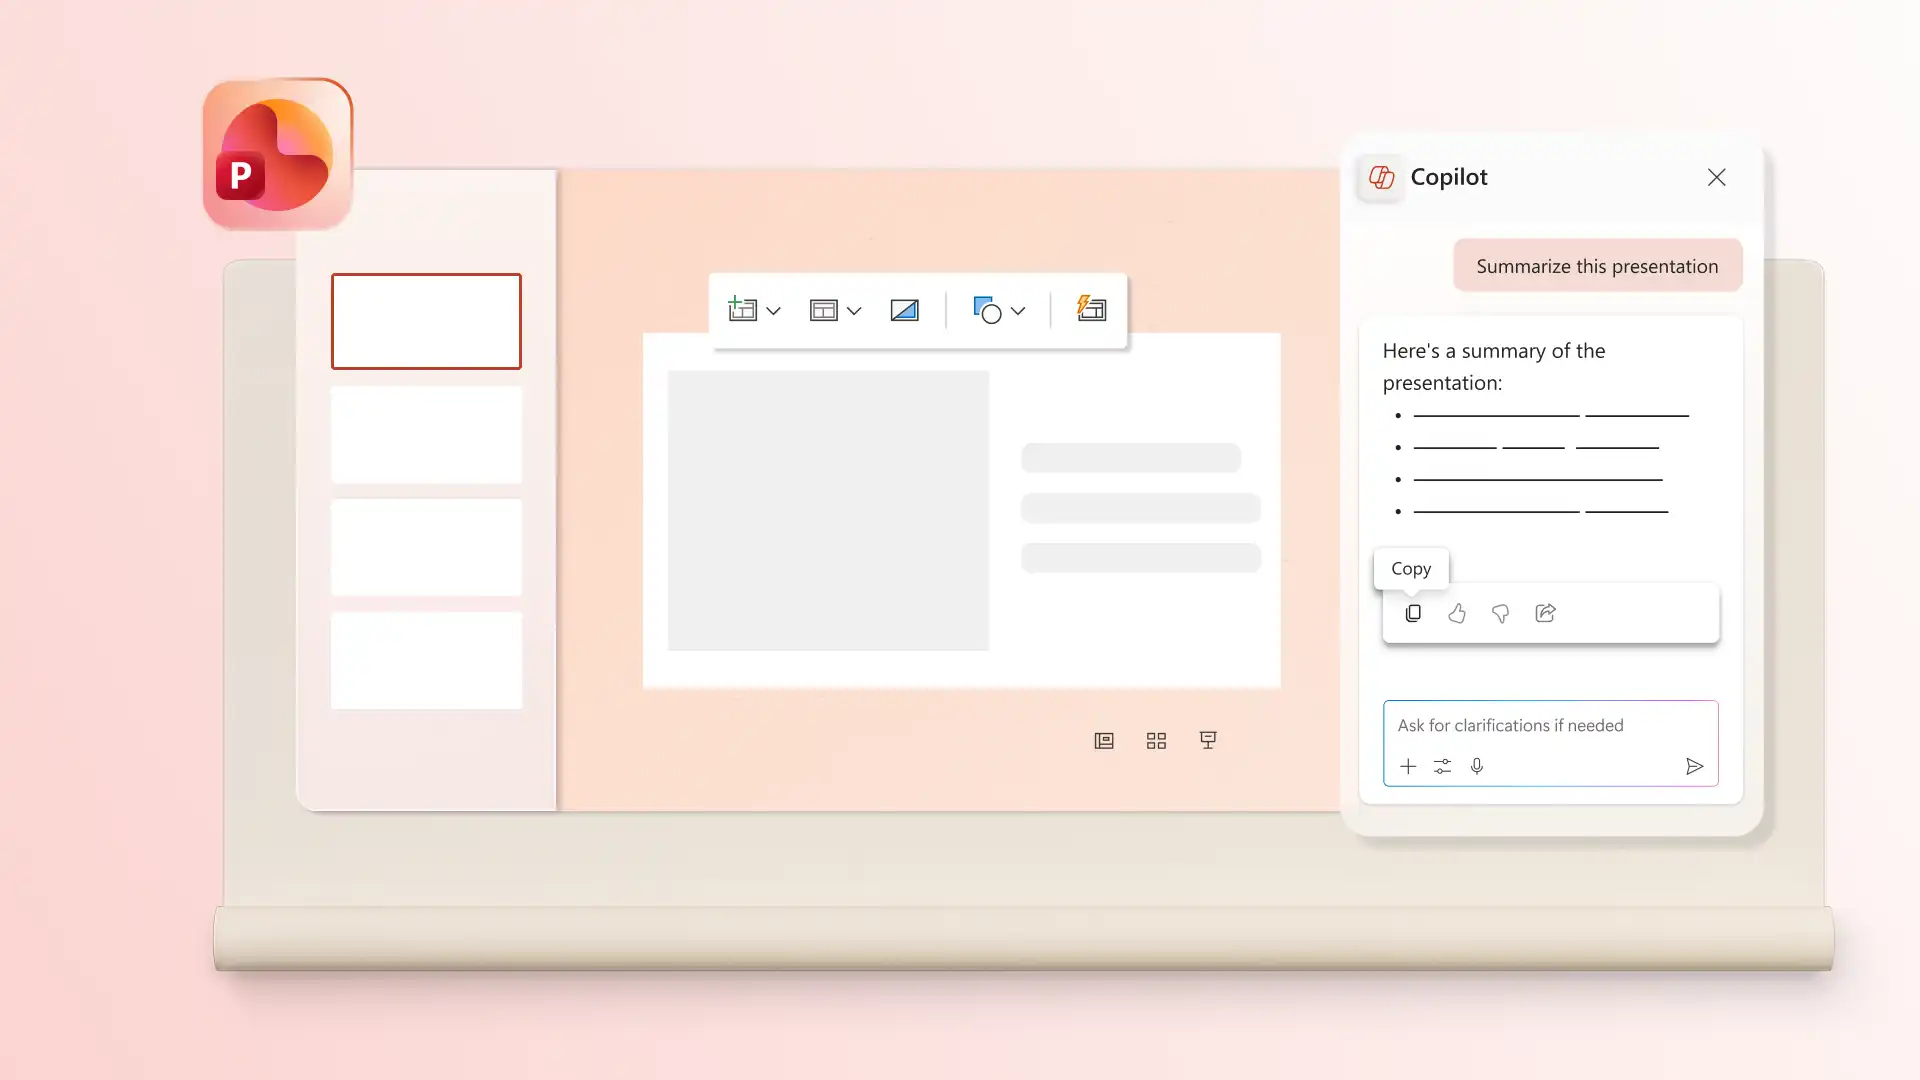
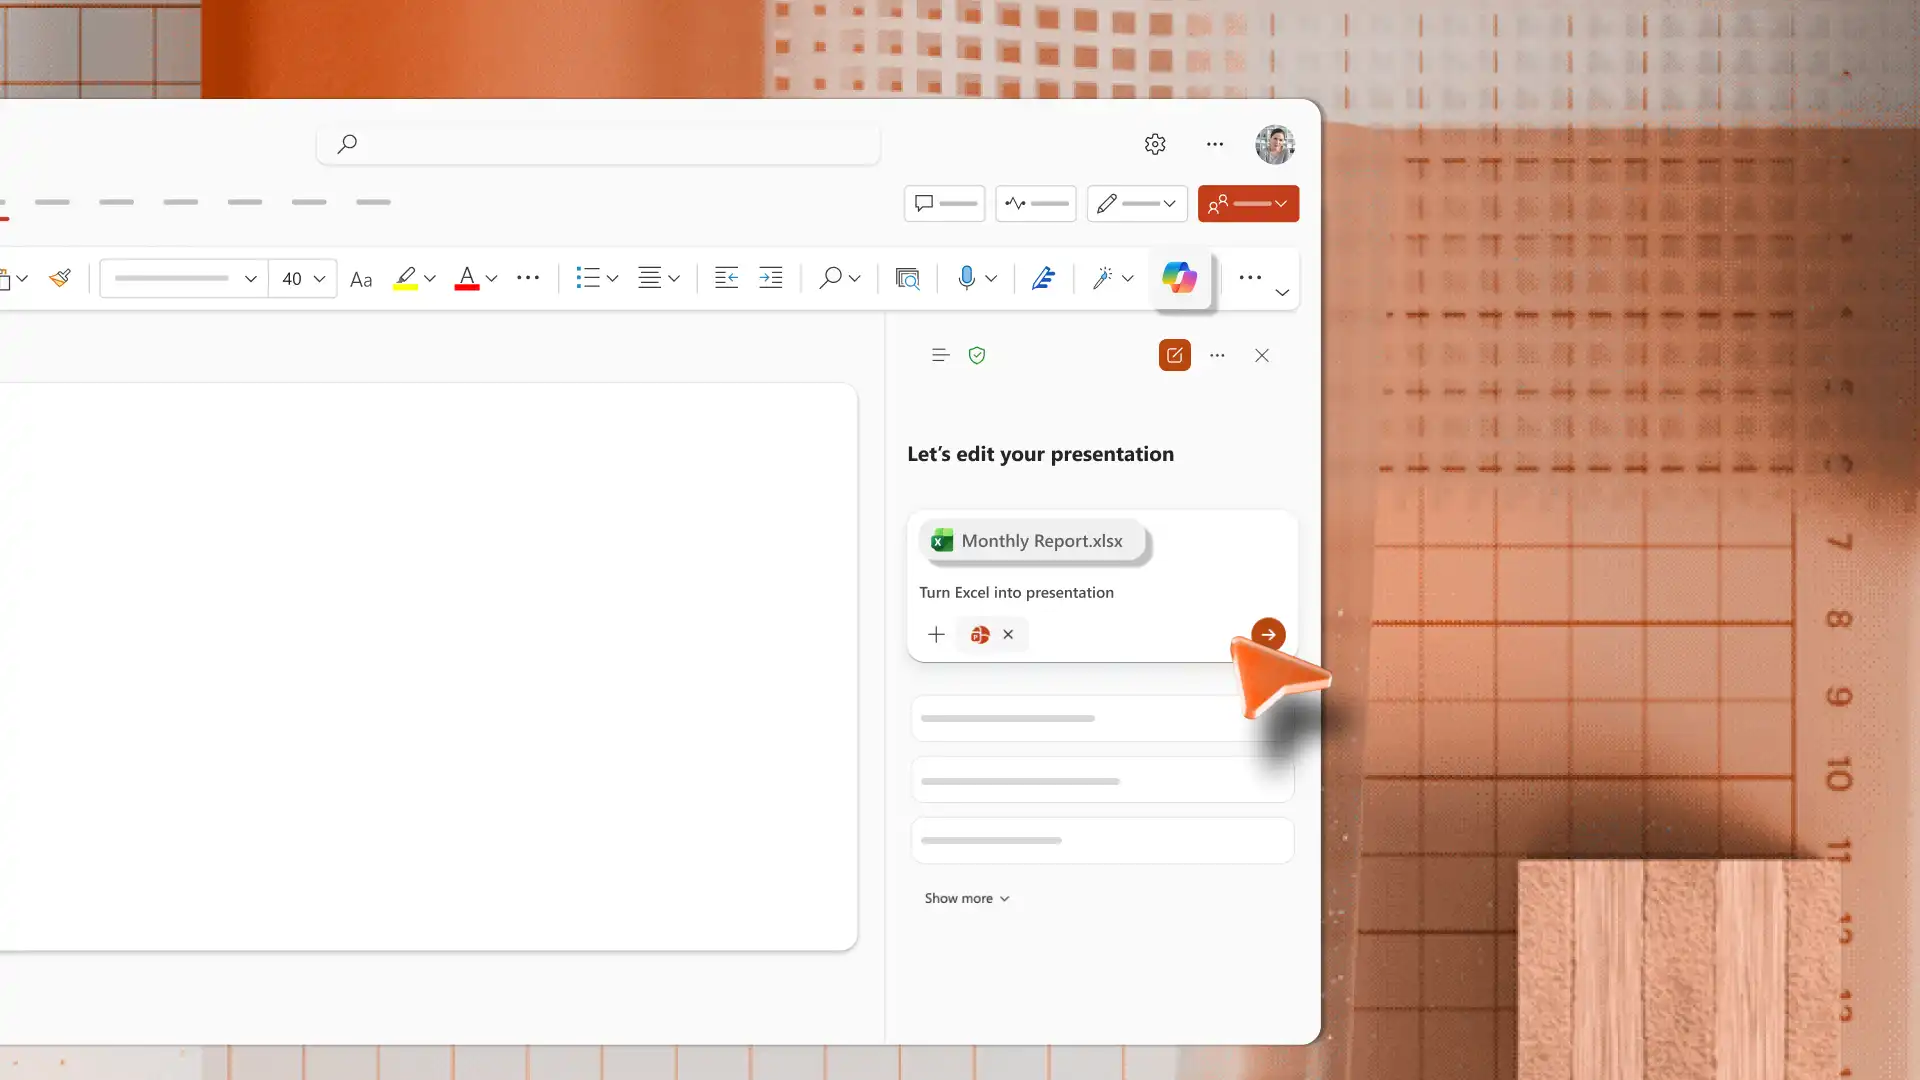
Generate slides from existing files using the AI presentation maker in PowerPoint. Upload an Excel file or document to Copilot chat and receive a presentation outline to review and apply. Review the suggested structure to organize and format slides, so the final deck is clear and easy to follow.
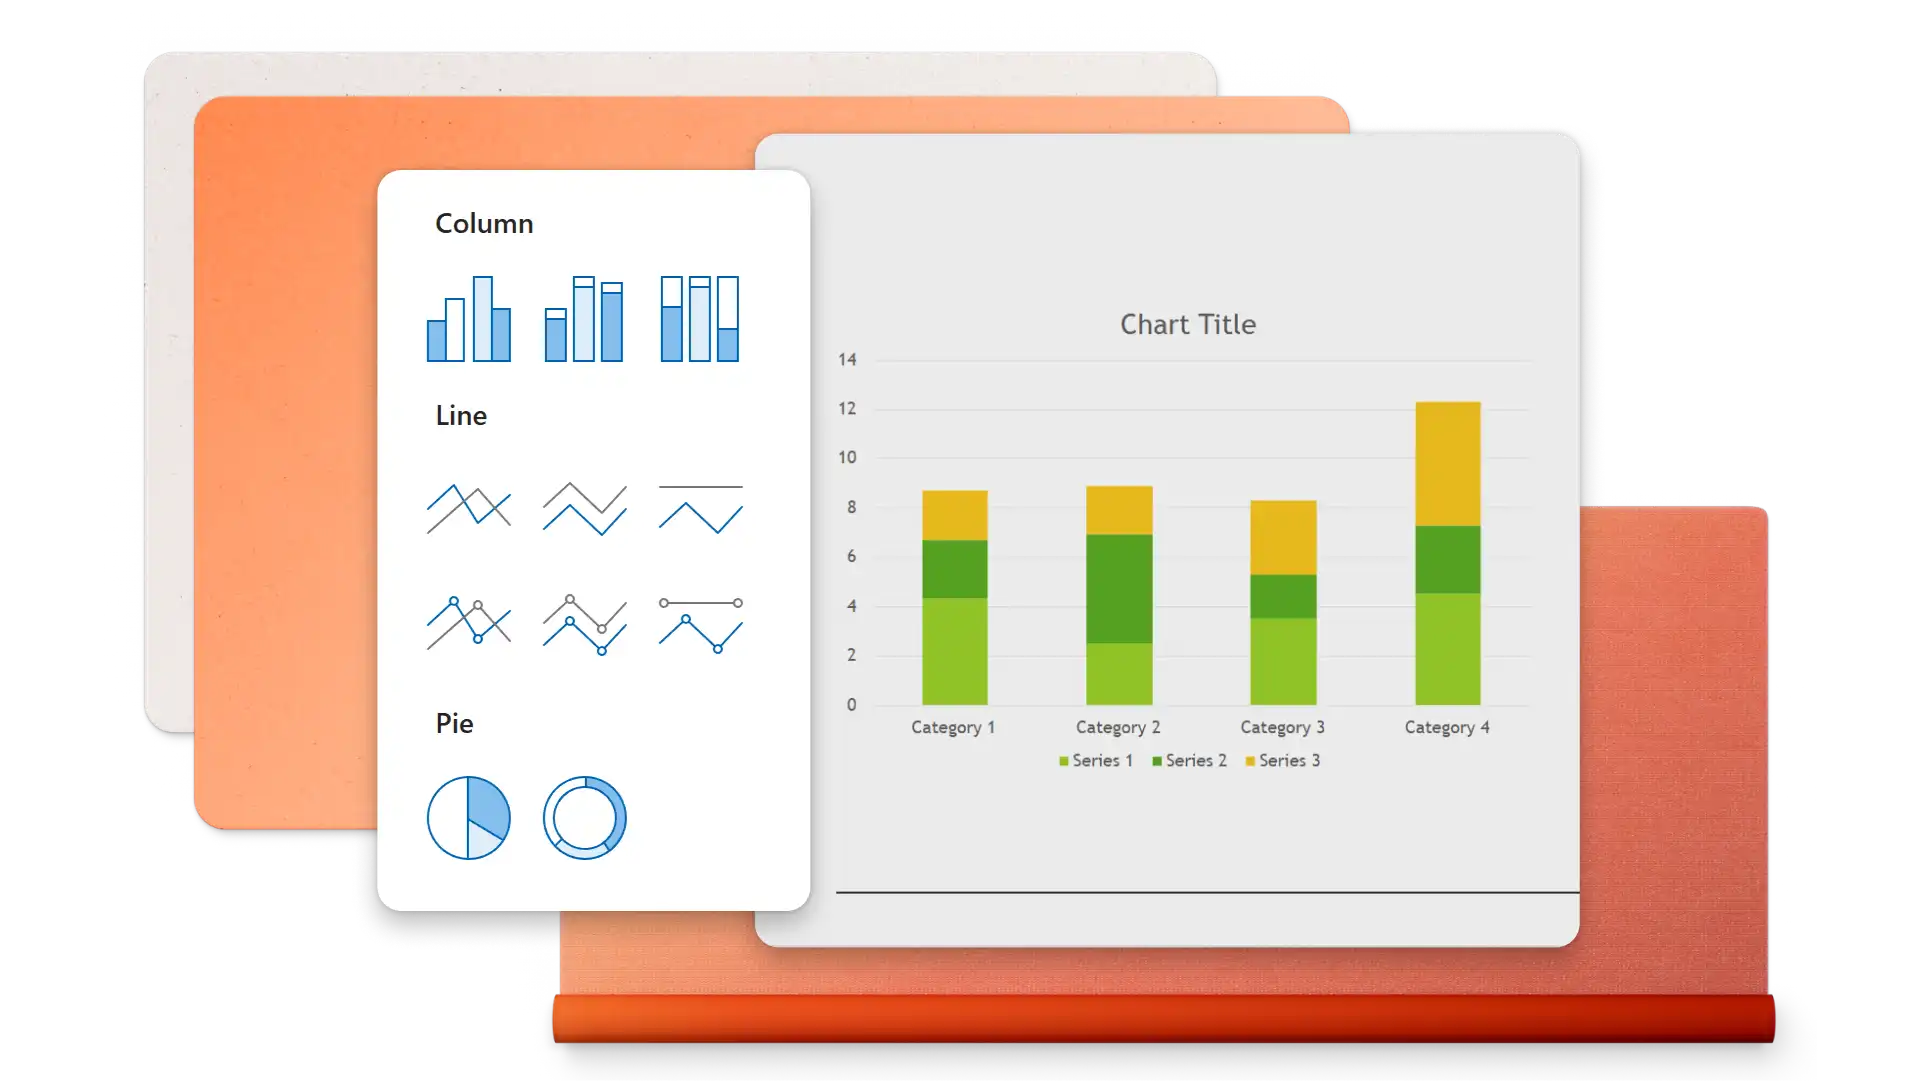
Insert charts, tables, diagrams, or timeline slides that directly support topics in a finance presentation. Use the right chart type for the data, such as line charts for trends, pie charts for proportions, or bar charts for comparisons. Keep one main insight per slide so the data supports the message.
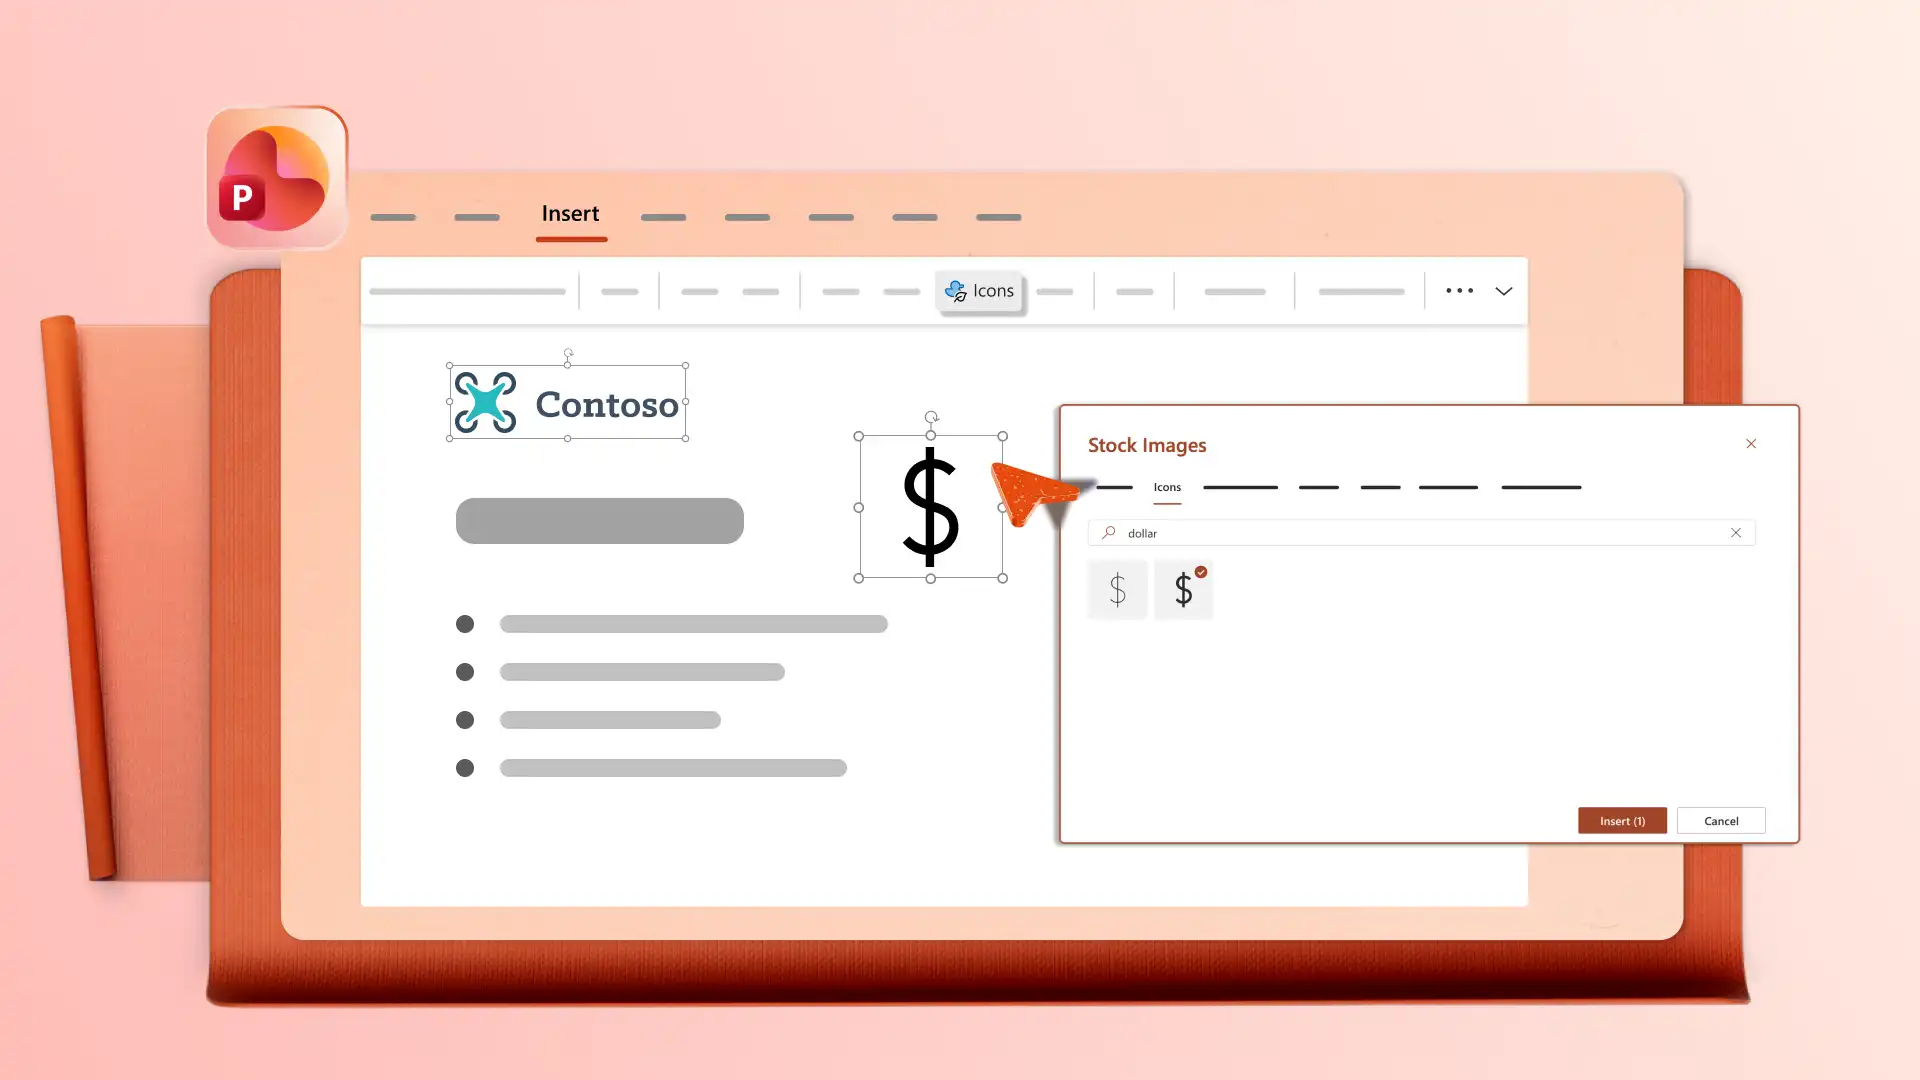
Add a company logo, apply brand colors, and choose fonts that match brand guidelines, so finance presentations look consistent with other company materials. Open the Design tab to review layout suggestions that organize content clearly. Use clean layouts so audiences can read the data and remember key points.
Edit finance presentations with a team using real-time collaboration tools like mentions and comments to review and add ideas. Download a presentation as a PDF or send a secure OneDrive link that always shows the latest version for stakeholders, clients, or board members.


Open PowerPoint for the web and start from blank or browse finance presentation templates.
Select a template and replace placeholder content with financial data and reports.
Insert charts, tables, and visuals to support key points in each slide.
Chat with Copilot in PowerPoint to generate outlines, summaries, or slides from attached files.
Save and share presentation via OneDrive link or download as a PDF.
Finance presentation templates work well for budget reviews, quarterly reports, investment pitches, and financial forecasts. Share these decks with executives, investors, or clients for business purposes. Personal finance presentations can also be shared with family or colleagues. Combine finance templates with sales presentations or business presentations for broader coverage.
Start with an executive summary that covers the main points, then move into detailed sections for revenue, expenses, profit and loss, and forecasts. Use a finance template to follow a ready-made structure and save time on formatting. End with key takeaways and next steps.
Use charts that match the data type, such as line charts for trends, pie charts for proportions, and bar charts for comparisons. Add timeline slides to show progress over time. Keep one main insight per slide so the visuals support the story rather than replace it.
Follow a clear structure using a finance template to cover key areas like summaries, data, and forecasts. Practice delivery with the coach in PowerPoint to review pacing, tone, and filler words. Keep slides focused on one insight each so the audience can follow along.