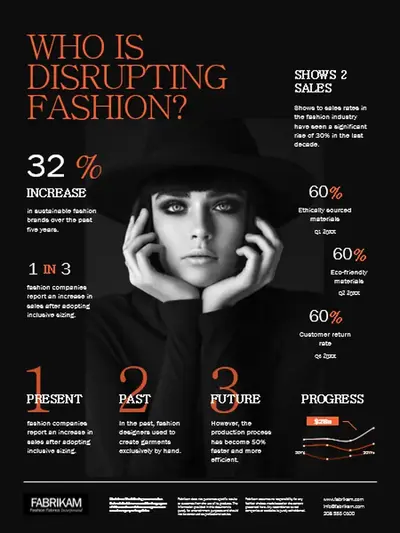
Ілюструйте модні тенденції
Використовувати цей шаблон

Візуалізуйте дані за допомогою цікавих шаблонів інфографіки, піктограм, часових шкал, блок-схем і рисунків SmartArt у Microsoft PowerPoint.

Доповнюйте будь-яку інфографіку безкоштовними професійними зображеннями, піктограмами й зручними для читання шрифтами. Перетягуйте елементи, щоб налаштовувати шаблони: додавайте числа й графіку або створюйте зображення за допомогою ШІ, щоб проілюструвати свої ідеї.

Створюйте єдиний стиль для всієї інфографіки за допомогою власної палітри фірмових кольорів, логотипа, шрифту й фонів для слайдів. Діліться брендованою інфографікою в соціальних мережах, вбудовуйте її в презентації та зміцнюйте статус лідера думок.

Працюйте разом над створенням інфографіки для шкільних завдань, навчання відділу продажів, бізнес-презентацій і графіків проєктів. Запрошуйте колег переглядати й редагувати матеріали за допомогою коментарів і згадок у презентаціях.

Заощаджуйте час завдяки настроюваним шаблонам інфографіки для графіків проєктів, блок-схем, дорожніх карт, організаційних діаграм і академічних постерів.

Зробіть складну інформацію зрозумілою за допомогою настроюваних схем і блок-схем SmartArt. Упорядковуйте вміст у списки, цикли, ієрархії та часові шкали. Імпортуйте наявні таблиці Excel до інфографіки, щоб дані залишались актуальними.
Спростіть складну інформацію за допомогою піктограм, ілюстрацій, стрілок, фігур і ліній із бібліотеки PowerPoint. Отримайте доступ до високоякісних професійних зображень як користувач Microsoft 365, щоб створювати пам’ятну інфографіку для навчання, роботи чи будь-яких інших потреб.
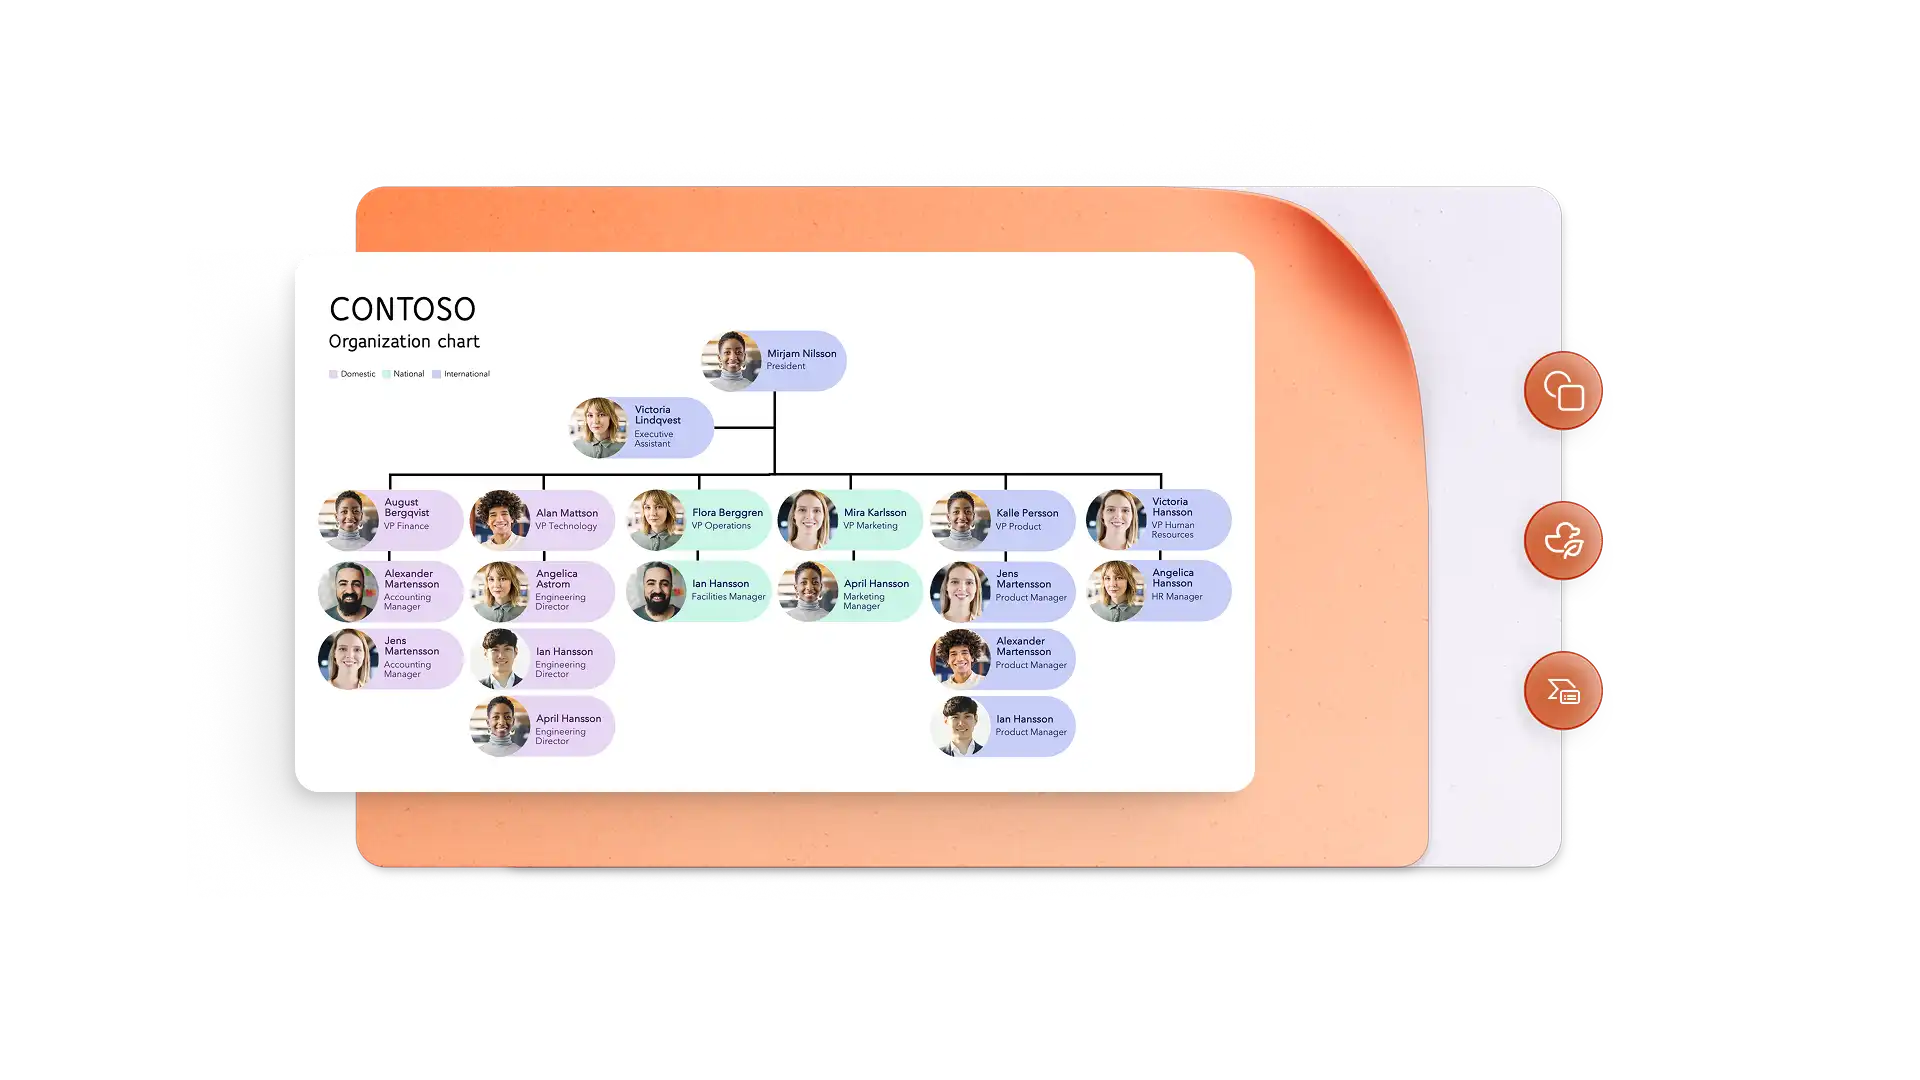

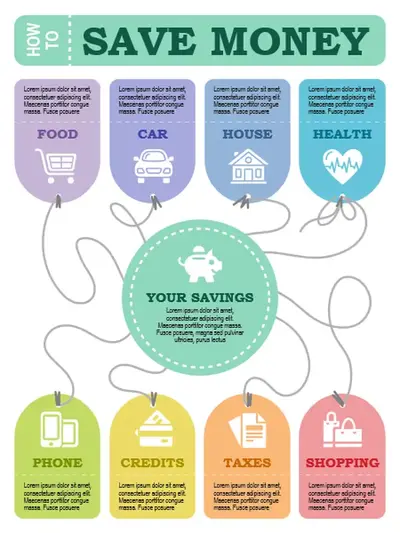
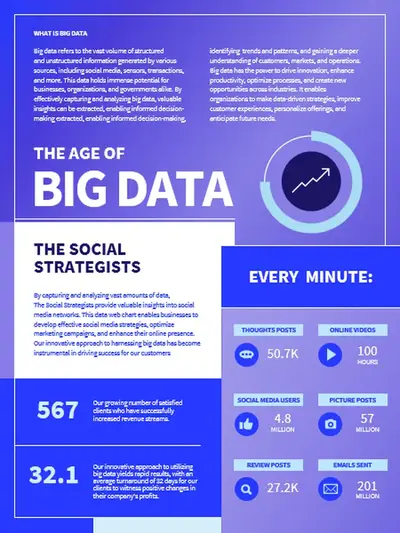
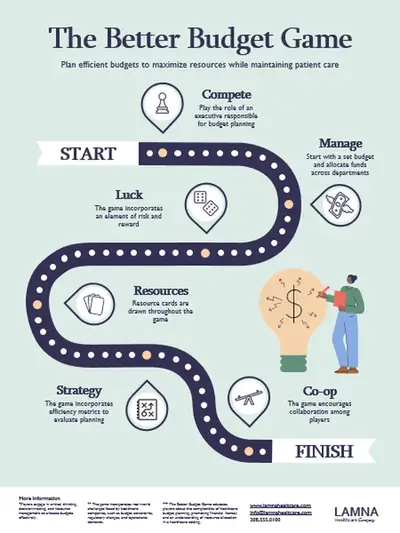
Надихайтеся на створення візуальних робіт за допомогою шаблонів інфографіки. Вибирайте чіткі макети оформлення для підсумків даних, потоків процесів і часових шкал або використовуйте кольорові теми, щоб підвищити залученість до звітів або презентацій. Створюйте привабливі візуальні елементи, які пояснюють ідеї, демонструють аналітичні висновки й чітко передають повідомлення без потреби оформляти все з нуля вручну.
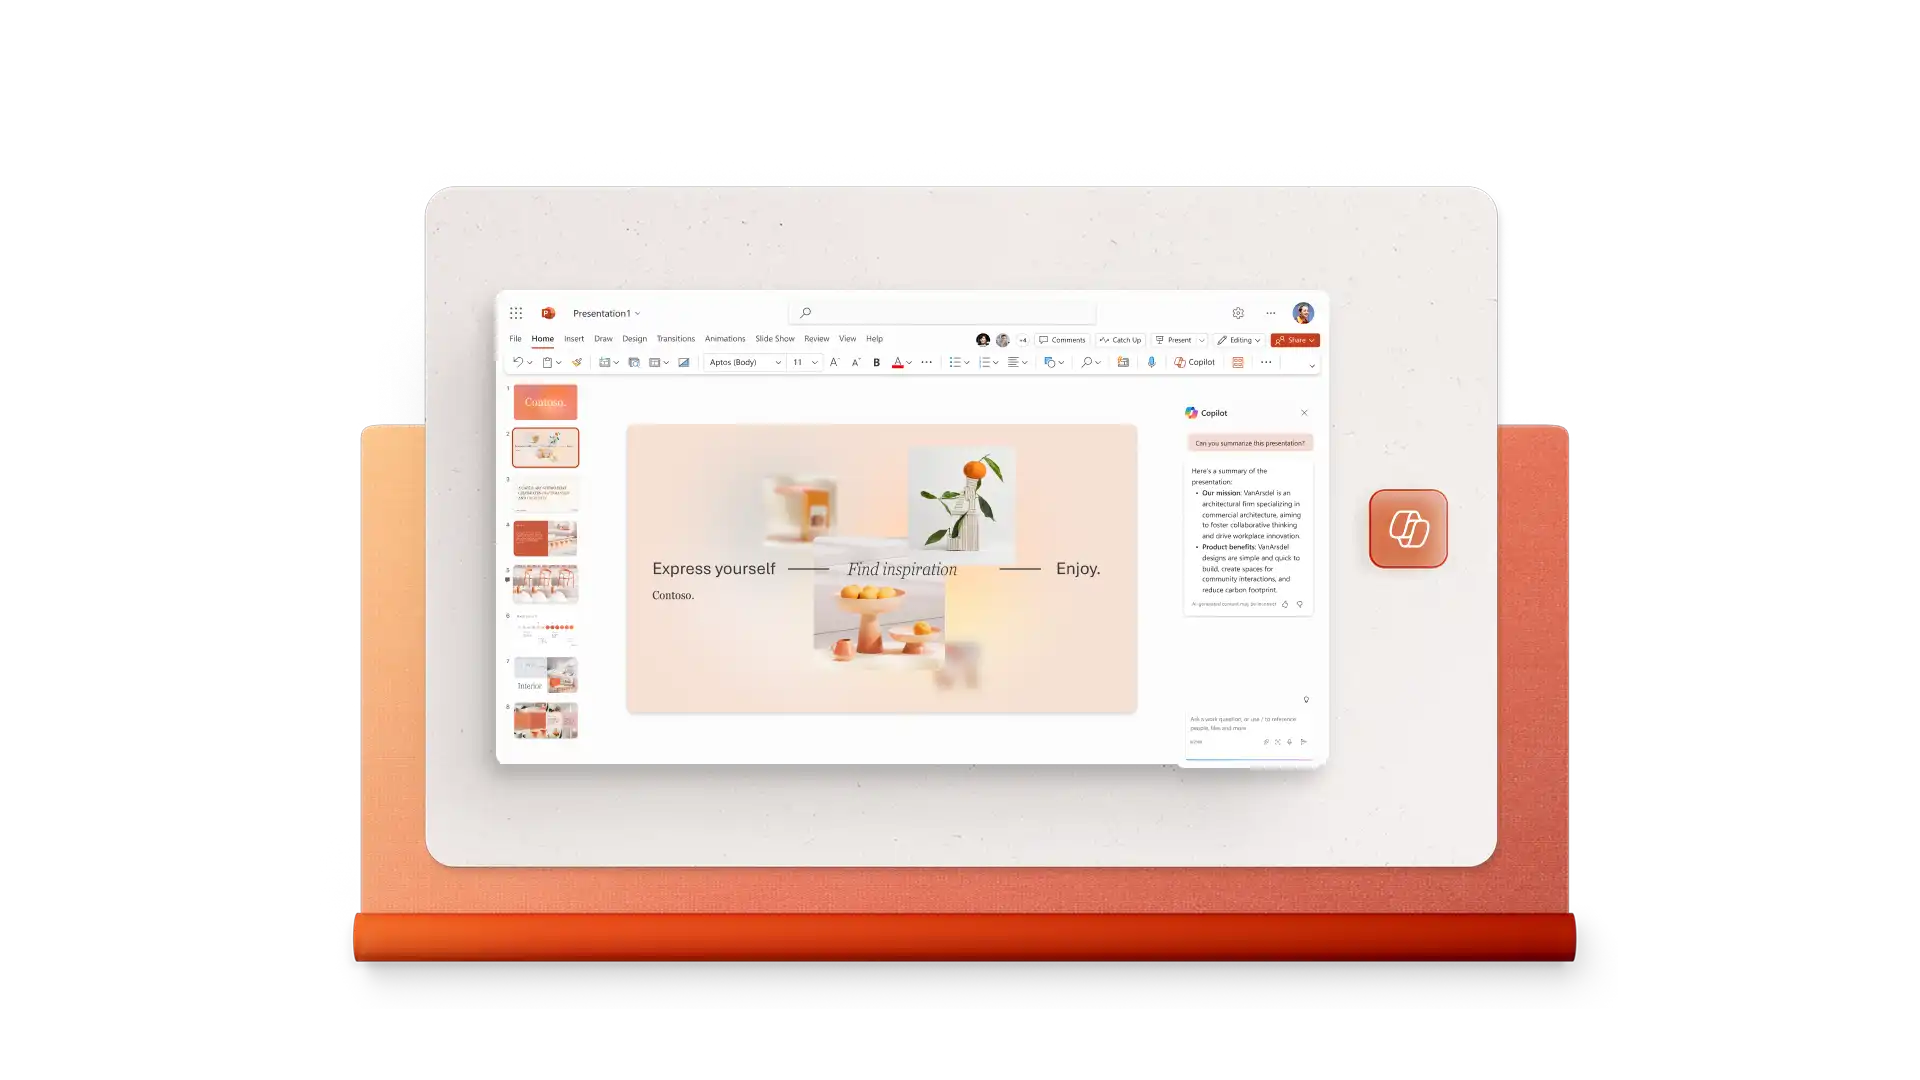
Створіть інфографіку з нуля за допомогою Copilot у PowerPoint. Поділіться темою або даними, щоб отримувати пропозиції щодо назв розділів, макетів, стислих описів для електронної пошти чи соціальних мереж, а також зображень, створених за допомогою ШІ, які відповідатимуть вмісту.

Запрошуйте учасників команди переглядати або редагувати інфографіку за допомогою кнопки "Поділитися" в PowerPoint. Додавайте коментарі й згадки, щоб запитувати інформацію чи отримувати відгуки, і співпрацюйте в режимі реального часу або асинхронно.
Діліться інфографікою онлайн у режимі презентації, експортуйте її у формат PDF або JPG для надсилання електронною поштою, завантажуйте на вебсайт або публікуйте в соціальних мережах. Легко друкуйте інфографіку за допомогою готових параметрів друку, які завжди мають вертикальний формат слайда.
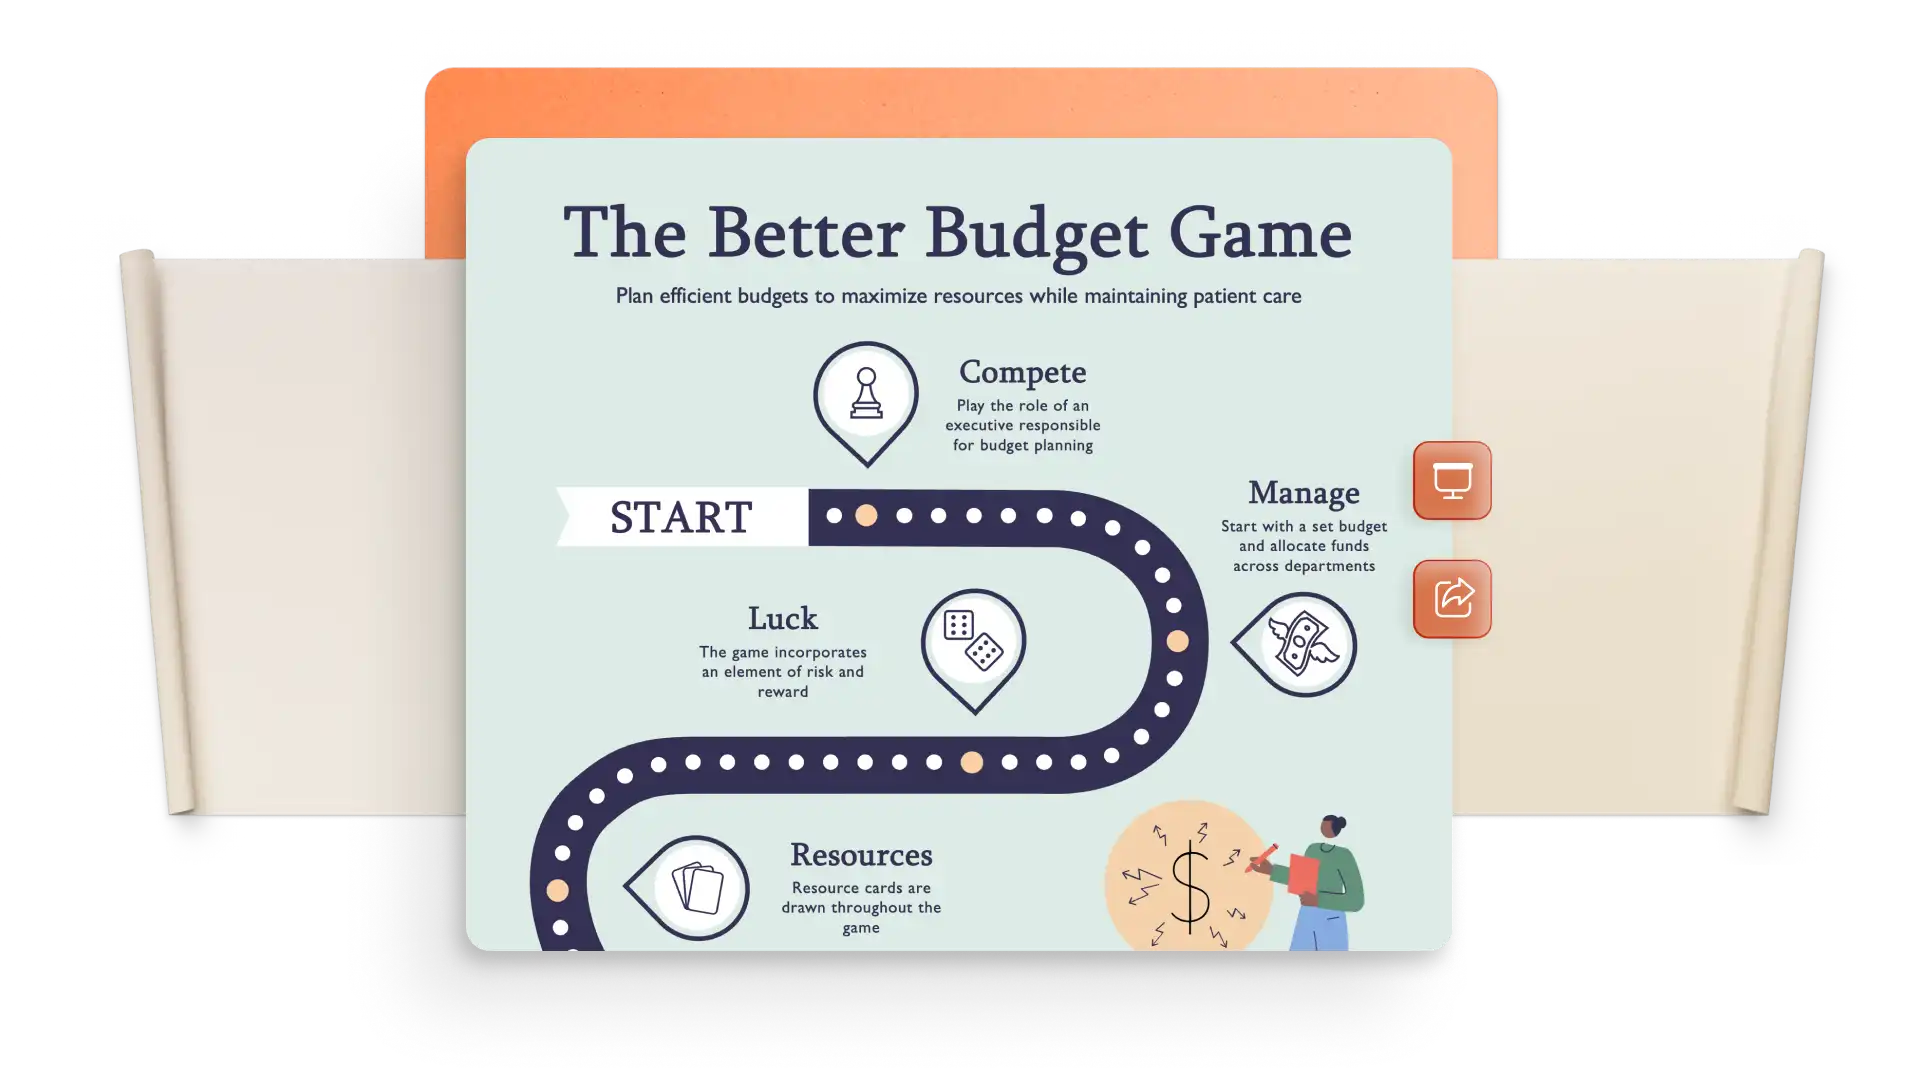
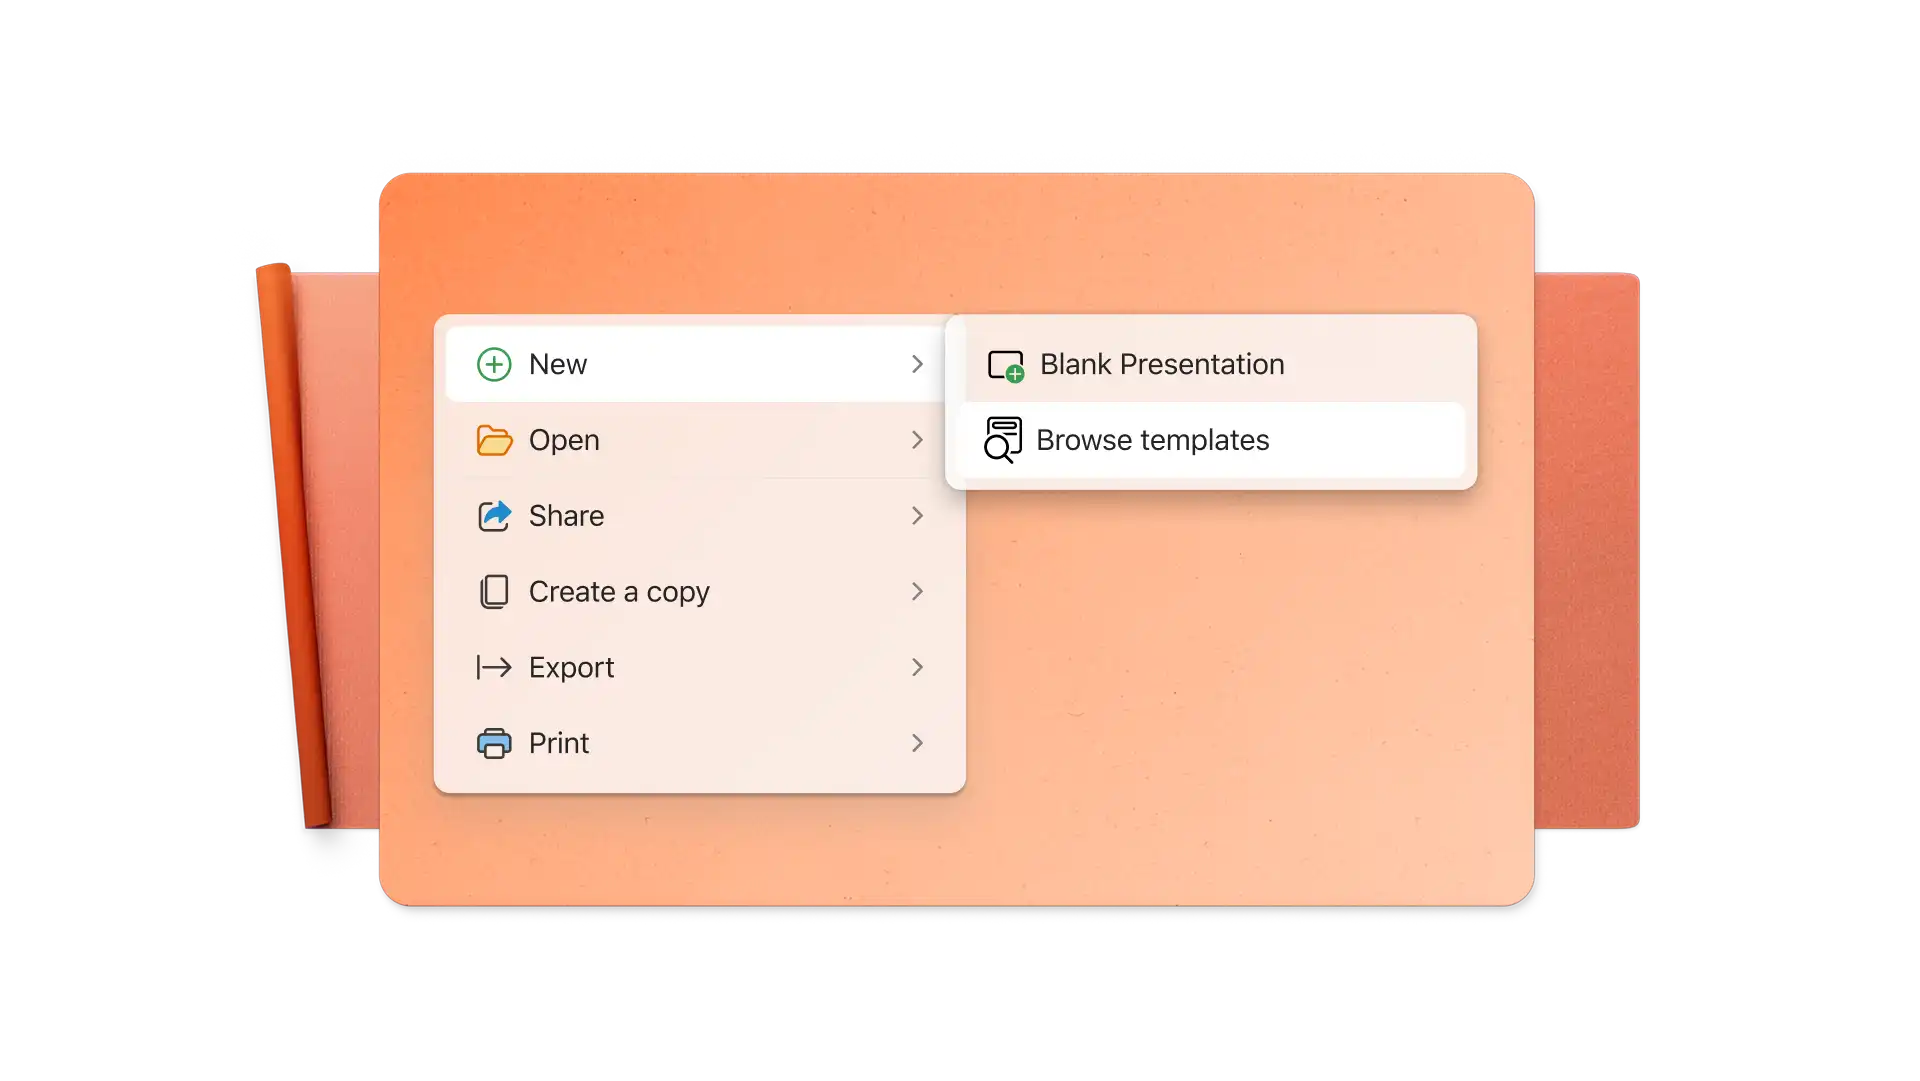
Виберіть шаблон інфографіки як основу.
Скористайтеся пропозиціями Copilot у PowerPoint, щоб створити фонове зображення.
Додайте інформацію у фігури й діаграми.
Виділіть ключові моменти за допомогою контрастних кольорів і читабельного тексту.
Експортуйте інфографіку у форматі PDF, JPG або показу слайдів у PowerPoint і діліться нею.
Маркетологи: створюйте легкий для сприйняття вміст для блогів, соціальних мереж, доповідей і маркетингових презентацій.
Організації: діліться ключовими висновками опитувань або досліджень і пояснюйте переваги продуктів.
Журналісти: перетворюйте тенденції та історії на інформаційно насичені візуальні матеріали для новинних репортажів.
Для навчання: спрощуйте складні теми, перетворюючи їх на корисні навчальні матеріали й презентації-плакати та вікторини.

Інфографіка – це візуальне подання ключової інформації та взаємозв’язків між її елементами. Інфографіка поєднує текст і дані з фігурами, кольорами, діаграмами й піктограмами, щоб допомогти читачам краще зрозуміти й запам’ятати інформацію. Вона корисна, зокрема, у презентаціях для освіти, маркетингу та бізнес-презентаціях.
Знайдіть шаблони інфографіки у PowerPoint, а потім виберіть потрібний і змініть його оформлення та вміст відповідно до своїх потреб.
У меню стрічки відкрийте вкладку "Анімація", щоб додати анімацію до будь-якого елемента інфографіки в PowerPoint. Усі, хто переглядає інфографіку в режимі презентації, бачитимуть вибрані анімаційні ефекти під час гортання слайдів. Анімацію інфографіки також можна записати як відео, щоб поділитися нею із ширшою аудиторією.
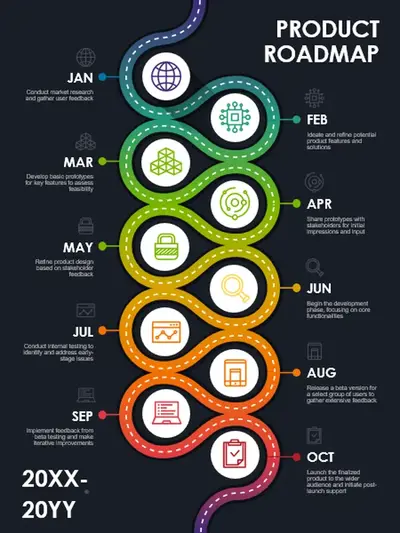
Почніть з інфографіки з часовою шкалою з бібліотеки шаблонів PowerPoint. Потім змініть кольори, зображення та піктограми відповідно до вашої часової шкали. Часову шкалу також можна створити з нуля. Додайте горизонтальну лінію на слайд із альбомною орієнтацією або вертикальну лінію на слайд із книжковою орієнтацією, а потім розмістіть піктограми, зображення та текст.